

Have you ever seen the stock prices moving on NSE or BSE? Naturally, you might have wondered how traders decide when to buy or sell. The answer is technical analysis.
To explain, it is a method of studying past price movements and trading volumes of a stock to predict where the price might head next.
When compared to fundamental analysis, which looks at a company’s financial health, this method focuses purely on charts and patterns.
Why Technical Analysis Matters for Indian Investors
In Indian markets, lakhs of retail traders participate every day. The stock prices, indices such as Nifty and Sensex, and commodities move based on certain factors. They are demand and supply, news, and investor sentiment. Chart-based study helps traders:
- Spot trends early, whether upward, downward, or sideways
- Decide the right entry and exit points
- Manage risk using stop-loss levels
- Time their trades better, especially for short-term positions
Core Assumptions Behind this Method
This approach is built on a few simple ideas:
- Price reflects everything: News, earnings, and sentiment are already factored into the current price
- Prices move in trends: Once a trend starts, it tends to continue until a clear reversal signal appears
- History repeats itself: Chart patterns that worked in the past often repeat. This is because human psychology around fear and greed doesn’t change much
Key Tools Used
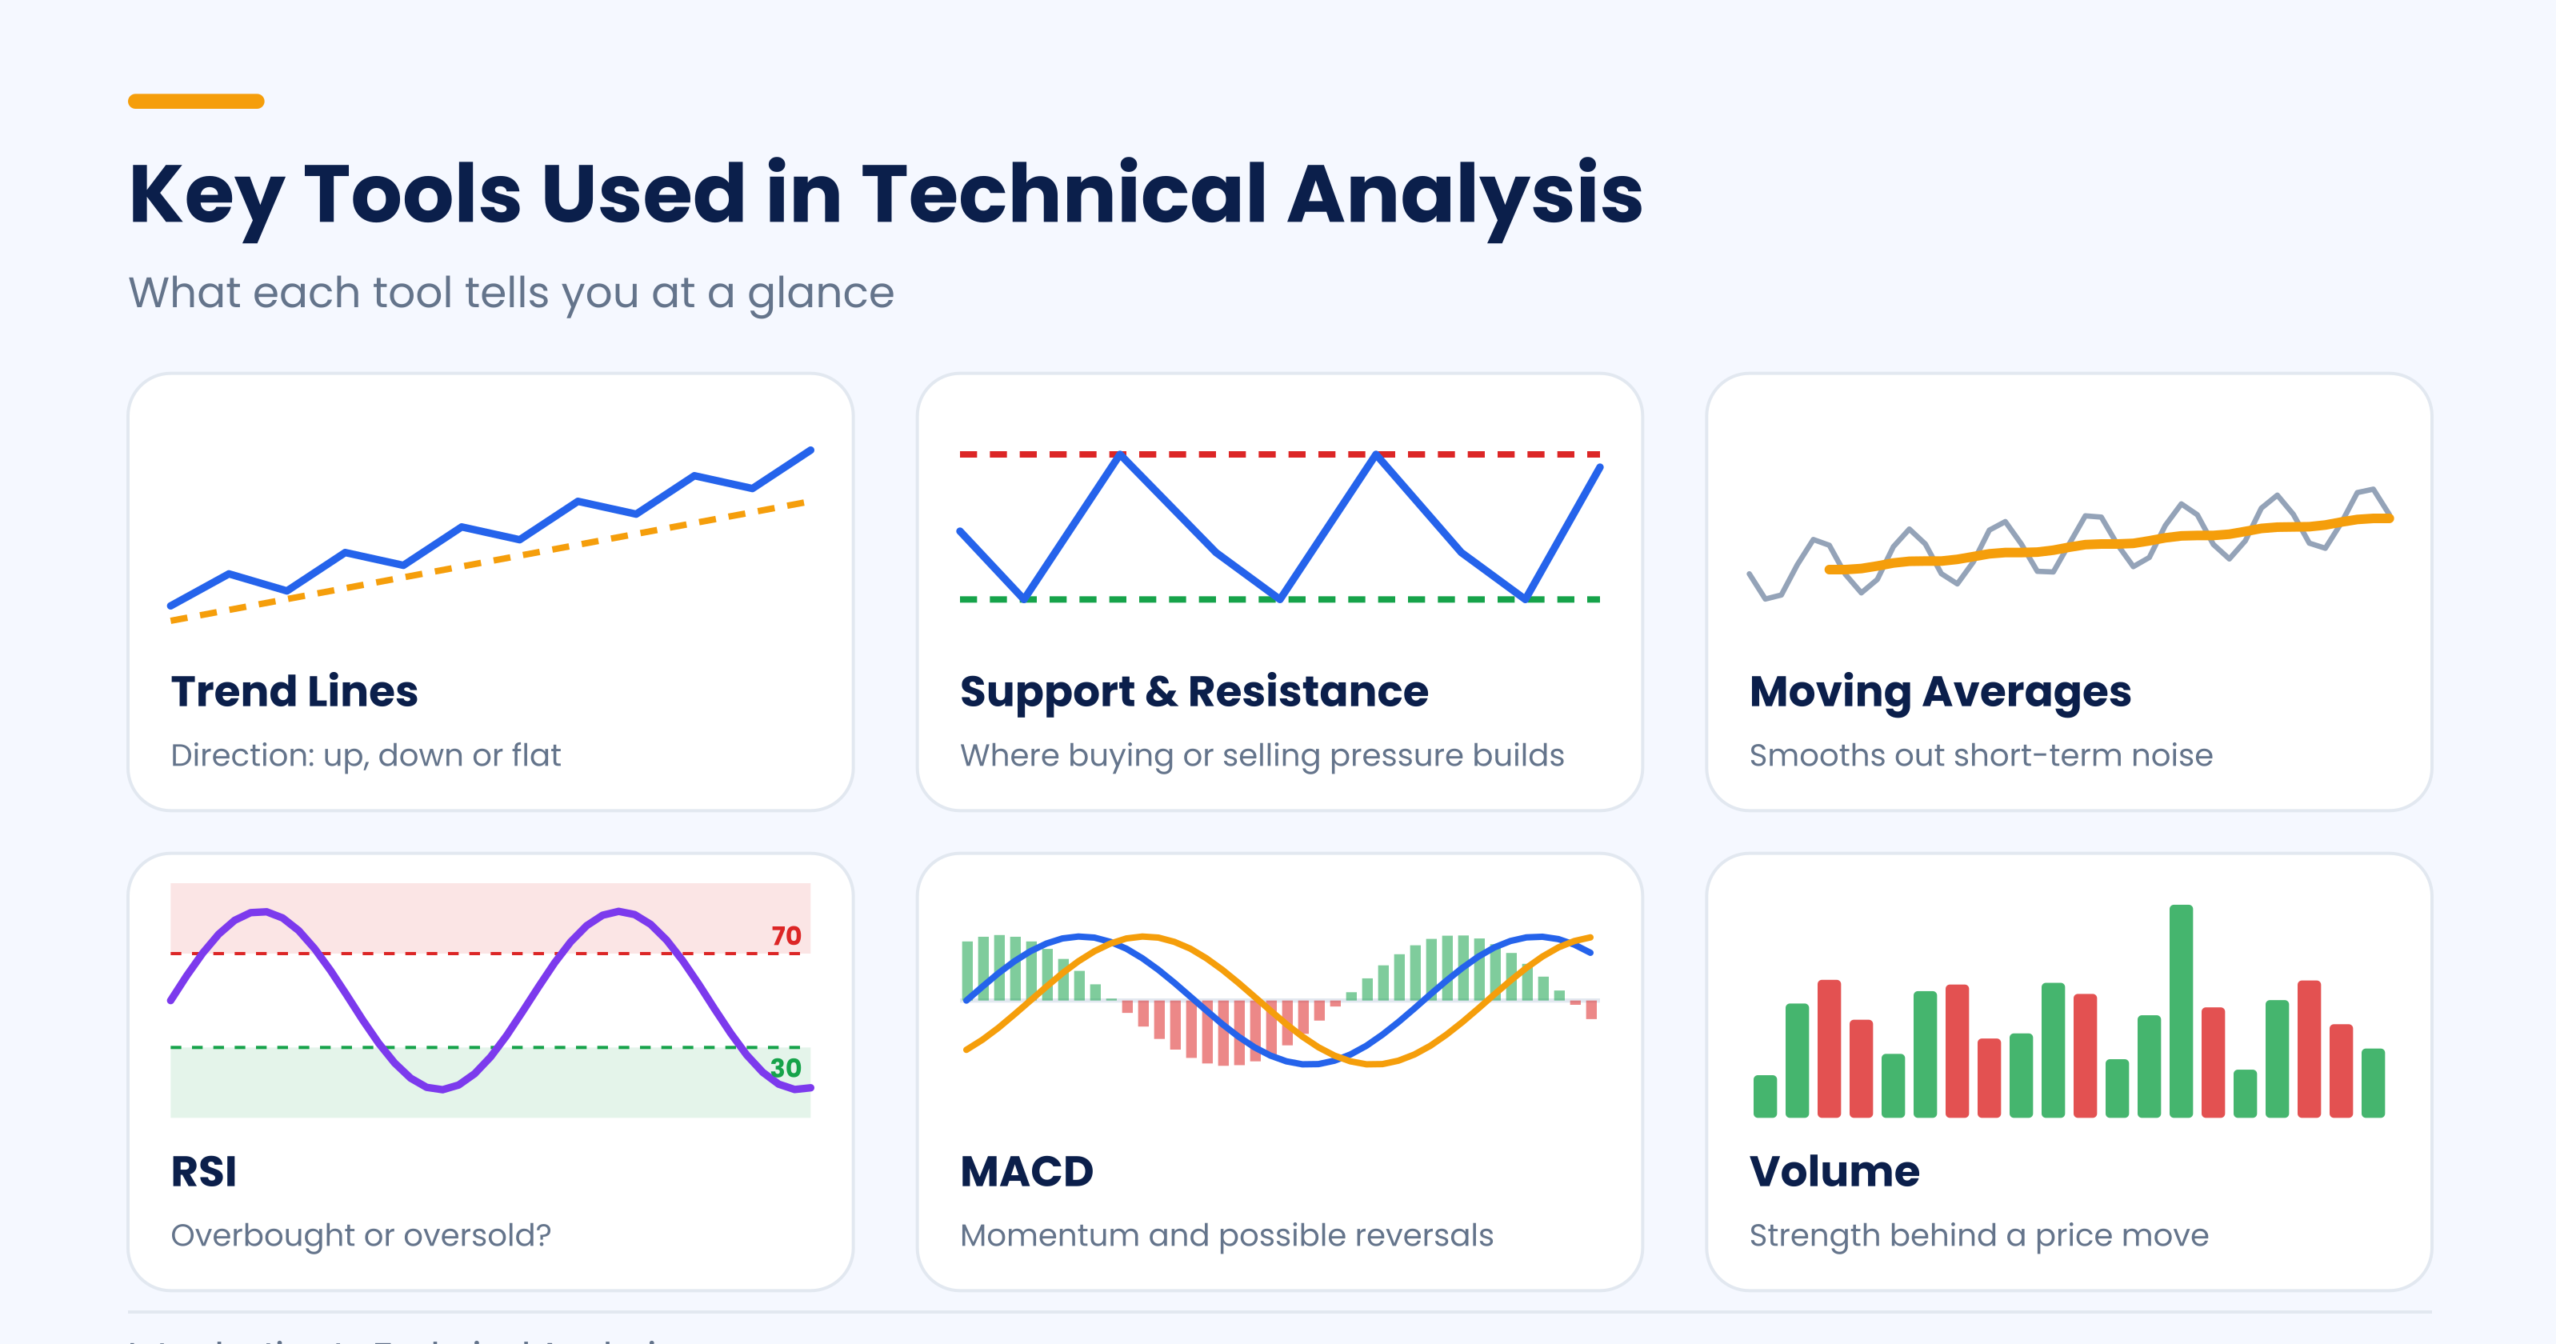
| Tool | What it Shows |
| Trend Lines | Direction of price movement i.e. up, down, or flat |
| Support & Resistance | Price levels where buying or selling pressure tends to increase |
| Moving Averages | Average price over a period, used to smoothen out short-term noise |
| RSI (Relative Strength Index) | Whether a stock is overbought or oversold |
| MACD | Momentum and possible trend reversals |
| Volume | Strength or weakness behind a price move |
Common Chart Types
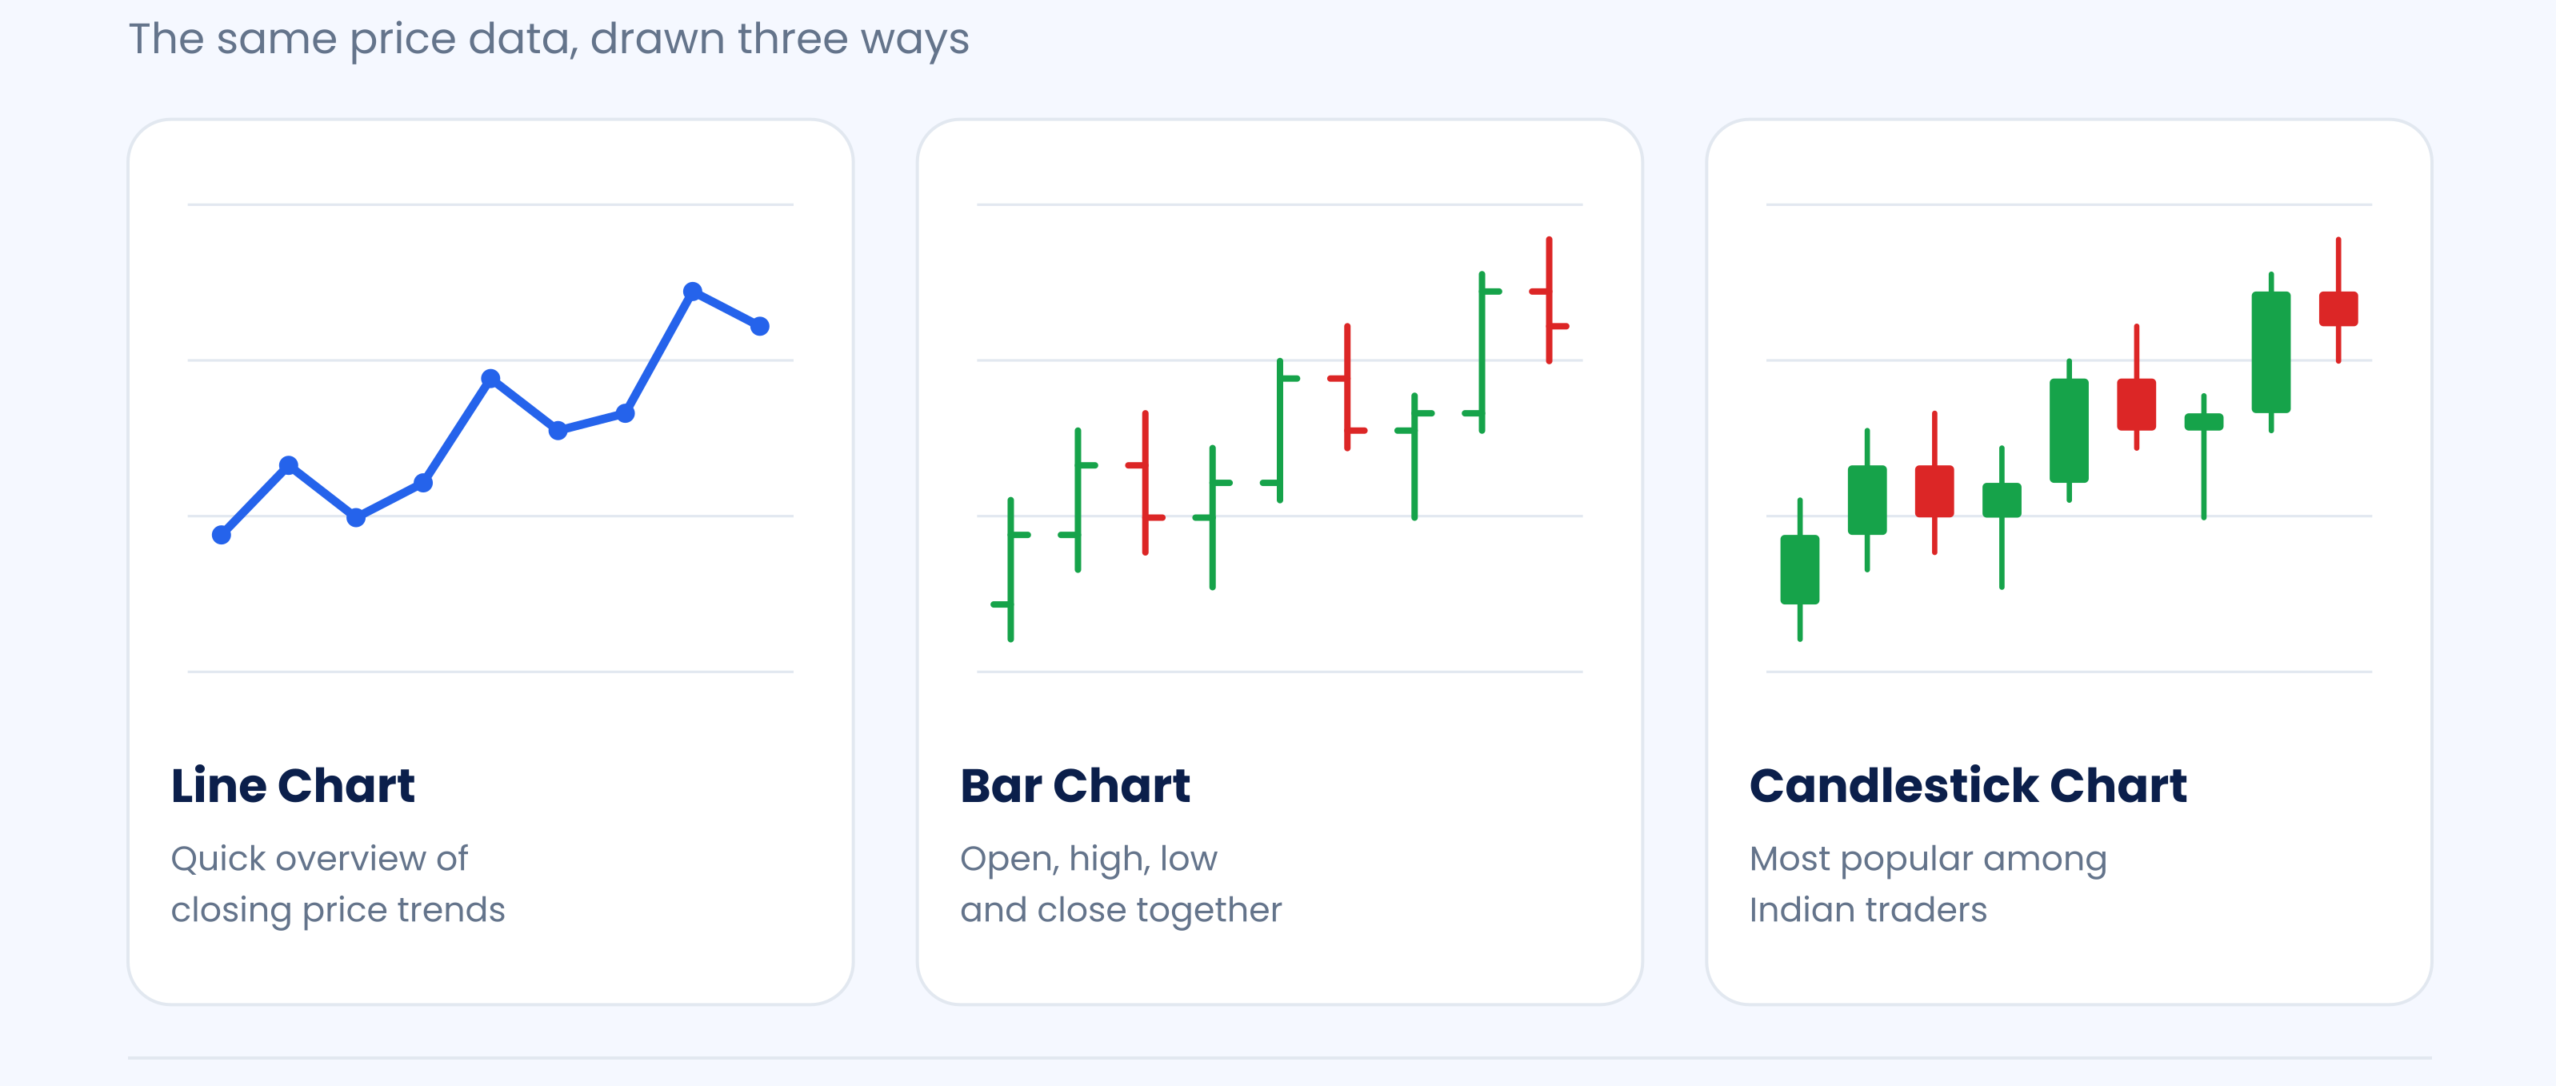
| Chart Type | Best Used for |
| Line Chart | Quick overview of closing price trends |
| Bar Chart | Viewing open, high, low, and close prices together |
| Candlestick Chart | Most popular among Indian traders; shows price action clearly with visual patterns |
Popular Chart Patterns
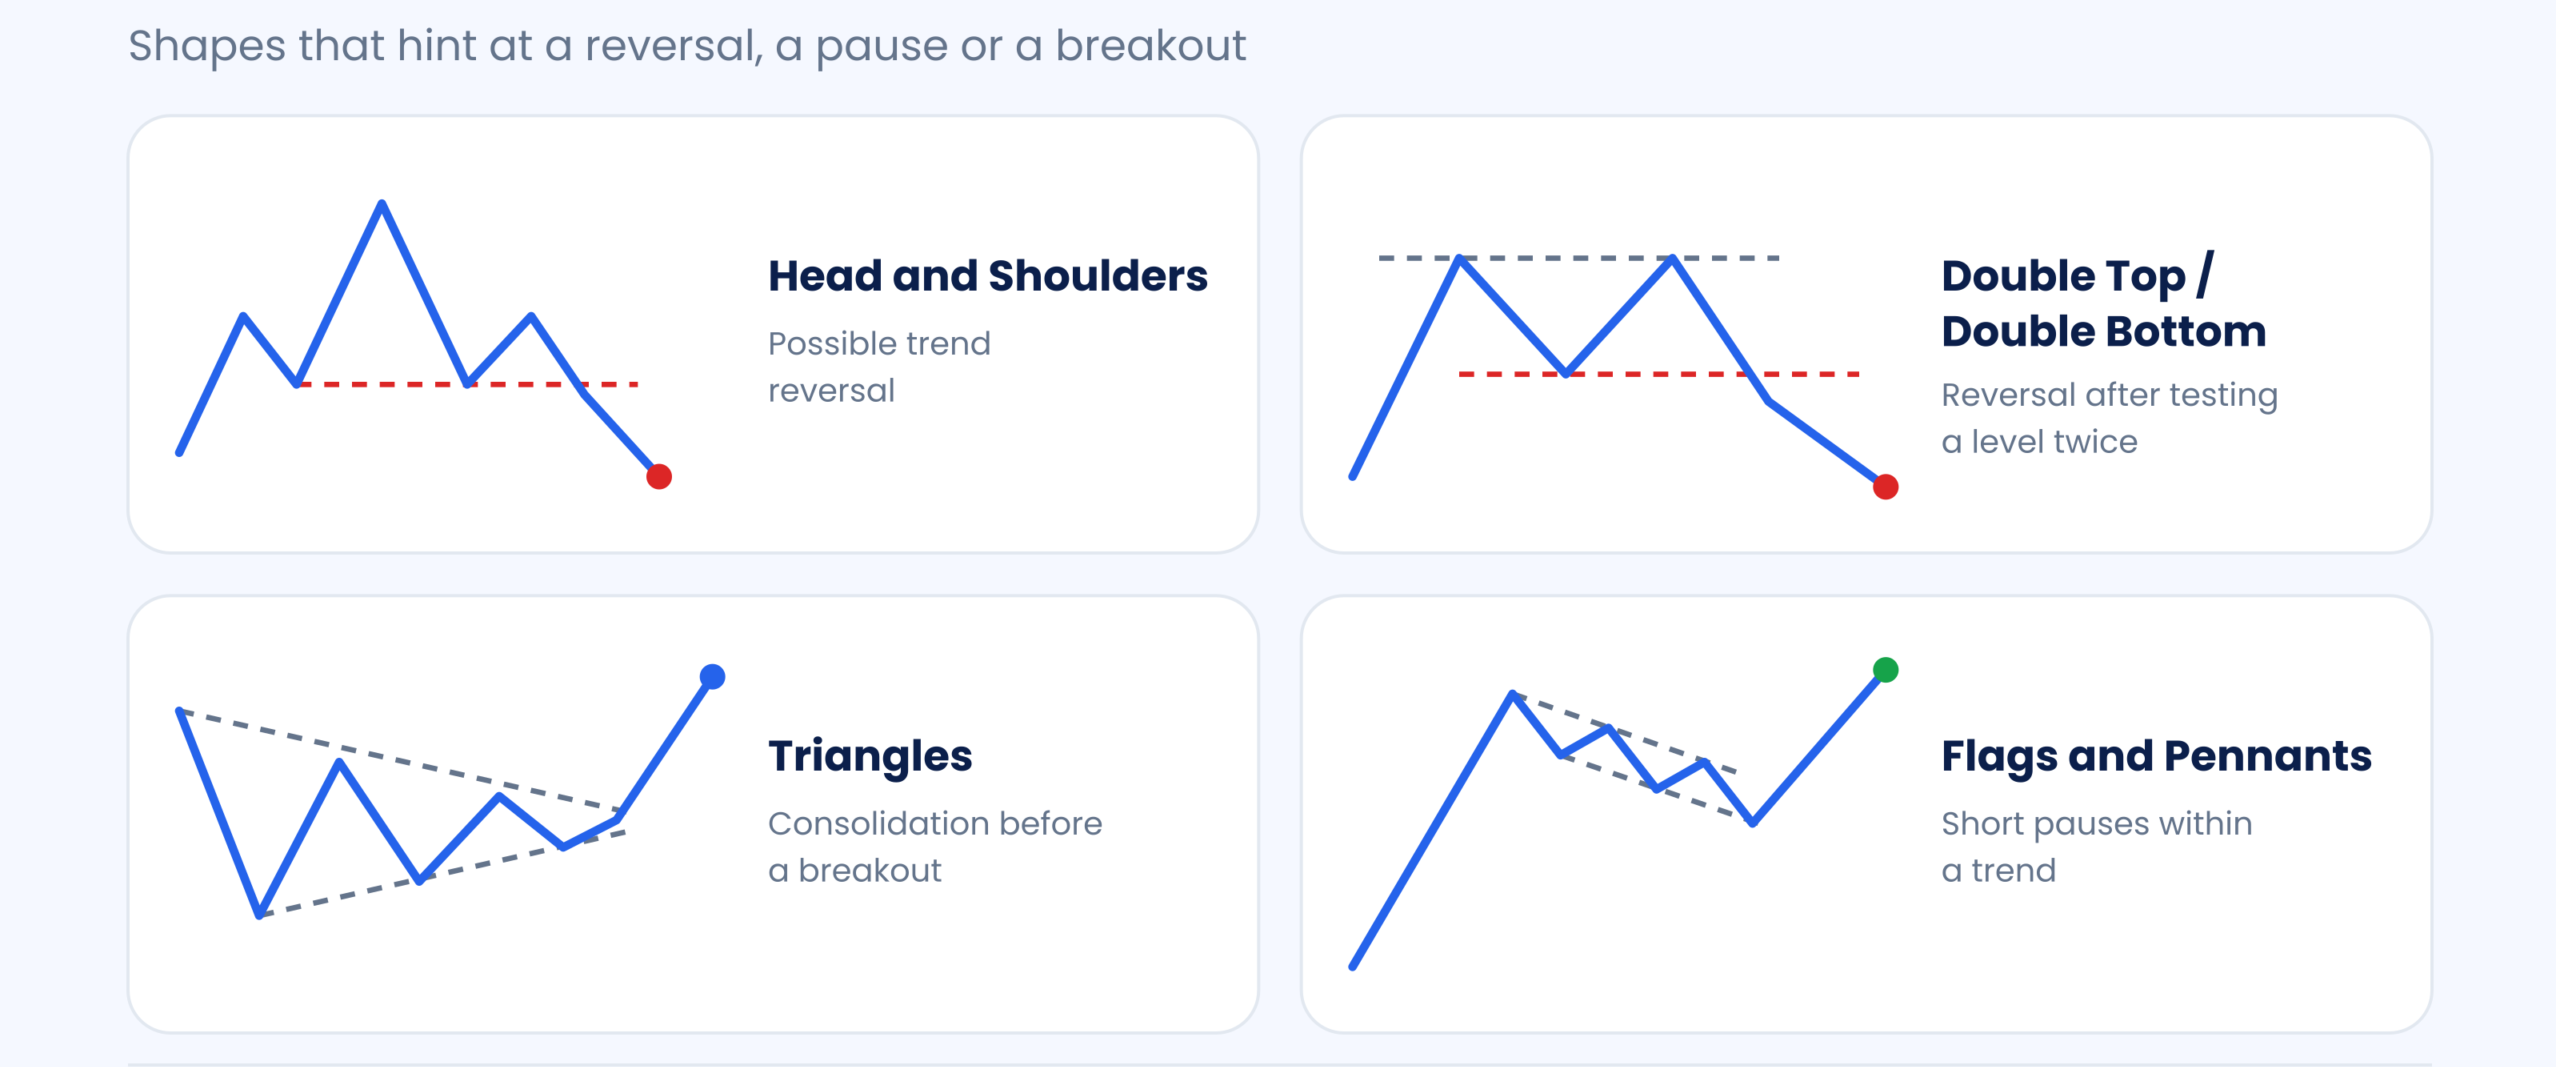
- Head and Shoulders: It indicates a possible trend reversal
- Double Top / Double Bottom: This signals that the price may reverse direction after testing a level twice
- Triangles: Triangles suggest the price is consolidating before a breakout
- Flags and Pennants: Short pauses within an ongoing trend
How to Get Started
- Learn the basics of chart reading – Start with candlestick patterns since they are widely used in Indian markets.
- Pick a reliable charting platform – Most Indian brokers offer built-in charting tools.
- Practice with a small number of indicators – Don’t overload your charts. 2-3 indicators are usually enough.
- Backtest your ideas – Check how a pattern or indicator performed historically before using it live.
- Always use a stop-loss – Protect your capital from unexpected price swings.
- Start small – Apply your learning with small trade sizes before scaling up.
Points To Remember
No method guarantees profits. For the unknown, markets can be unpredictable. Also, even well-read charts can give false signals. Thus combining them with proper risk management, discipline, and a clear trading plan would be the best approach to follow.
Last but not least, beginners should paper-trade before committing actual capital. For the unknown, paper trading is nothing but practicing without real money.
Conclusion
With technical analysis, Indian traders and investors are getting a structured way to read market behaviour.
This is done with charts, patterns, and indicators. However, don’t expect to become a successful trader overnight with technical analysis.
That said, with consistent practice and disciplined risk management, technical analysis can become a valuable part of your trading toolkit.
Hence, start simple, stay patient, and let your skills grow with experience.
|
Also Read |
|
| Types of Market Structure | |
| Types of Candlestick Patterns | |
