

Candlestick patterns help traders understand the price movement and market sentiment at a glance.
Each candlestick shows four prices for a chosen time period. They are open, high, low, and close — and the shape of the candlestick can hint at whether buyers or sellers are in control.
For Indian traders following stocks on the NSE or BSE, learning to read these patterns is a useful first step in technical analysis.
Indications of a Candlestick
There are two parts to a single candlestick:
- Body – the thick part, showing the range between the opening and closing price
- Wick (or shadow) – the thin lines above and below the body, showing the highest and lowest price reached
A green (or white) candle generally means the closing price was higher than the opening price.
On the other hand, a red (or black) candle means the closing price was lower than the opening price.
Single Candlestick Patterns
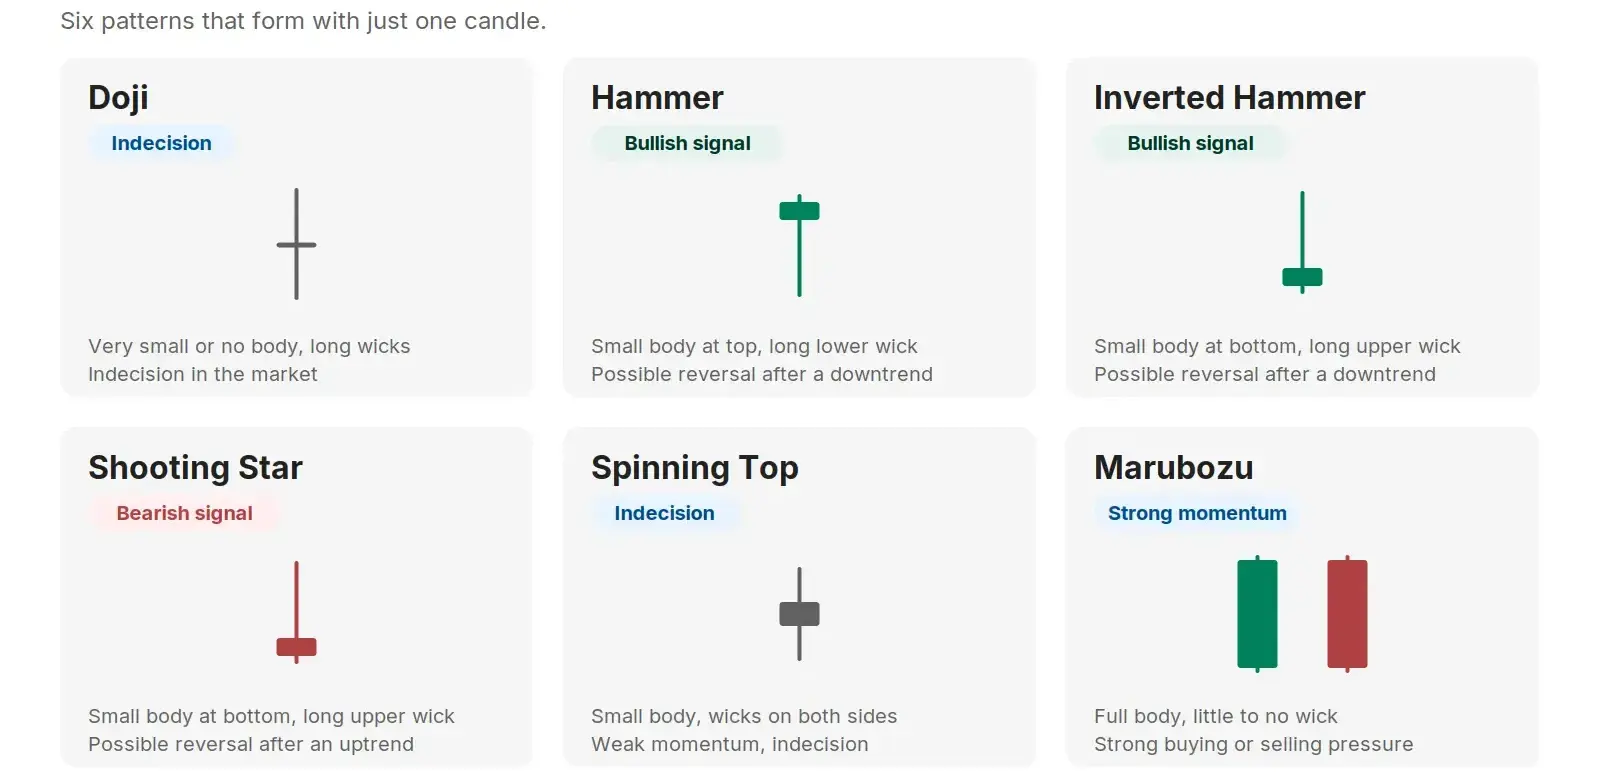
These patterns form using just one candle and are easy to spot on a chart.
| Pattern | How it Looks | What it Suggests |
| Doji | Very small or no body, long wicks | Indecision in the market |
| Hammer | Small body at top, long lower wick | Possible reversal after a downtrend |
| Inverted Hammer | Small body at bottom, long upper wick | Possible reversal after a downtrend |
| Shooting Star | Small body at bottom, long upper wick, appears after uptrend | Possible reversal after an uptrend |
| Spinning Top | Small body, wicks on both sides | Weak momentum, indecision |
| Marubozu | Full body, little to no wick | Strong buying or selling pressure |
Double Candlestick Patterns
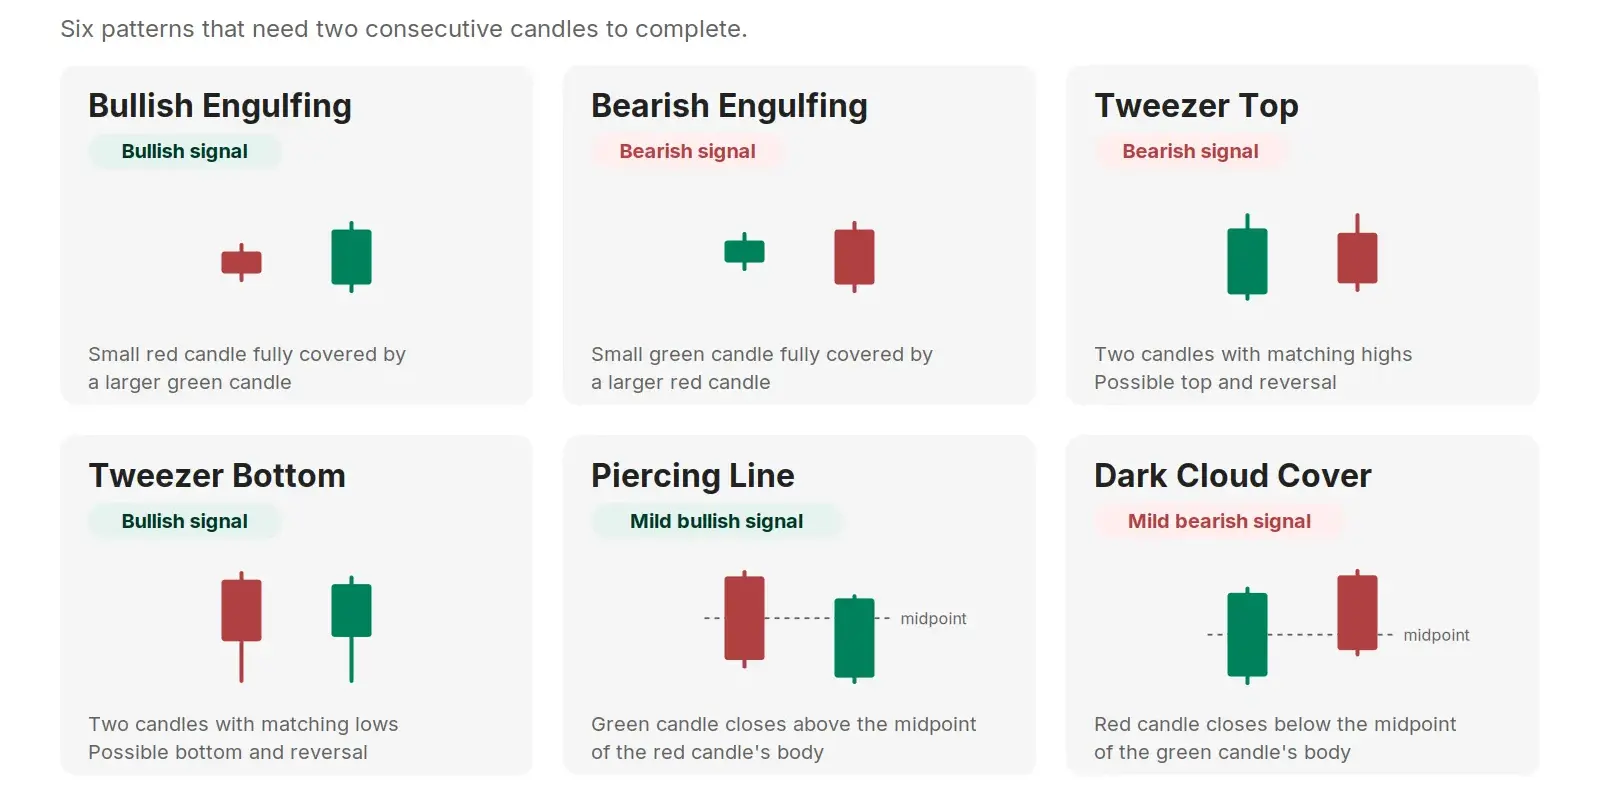
These patterns need two consecutive candles to complete.
- Bullish Engulfing – A small red candle followed by a larger green candle that fully covers it. Suggests buyers have taken over after a downtrend.
- Bearish Engulfing – A small green candle followed by a larger red candle that fully covers it. Suggests sellers have taken over after an uptrend.
- Tweezer Top – Two candles with matching highs, signaling a possible top and reversal.
- Tweezer Bottom – Two candles with matching lows, signaling a possible bottom and reversal.
- Piercing Line – A red candle followed by a green candle that closes above the midpoint of the red candle’s body. A mild bullish signal.
- Dark Cloud Cover – A green candle followed by a red candle that closes below the midpoint of the green candle’s body. A mild bearish signal.
Triple Candlestick Patterns
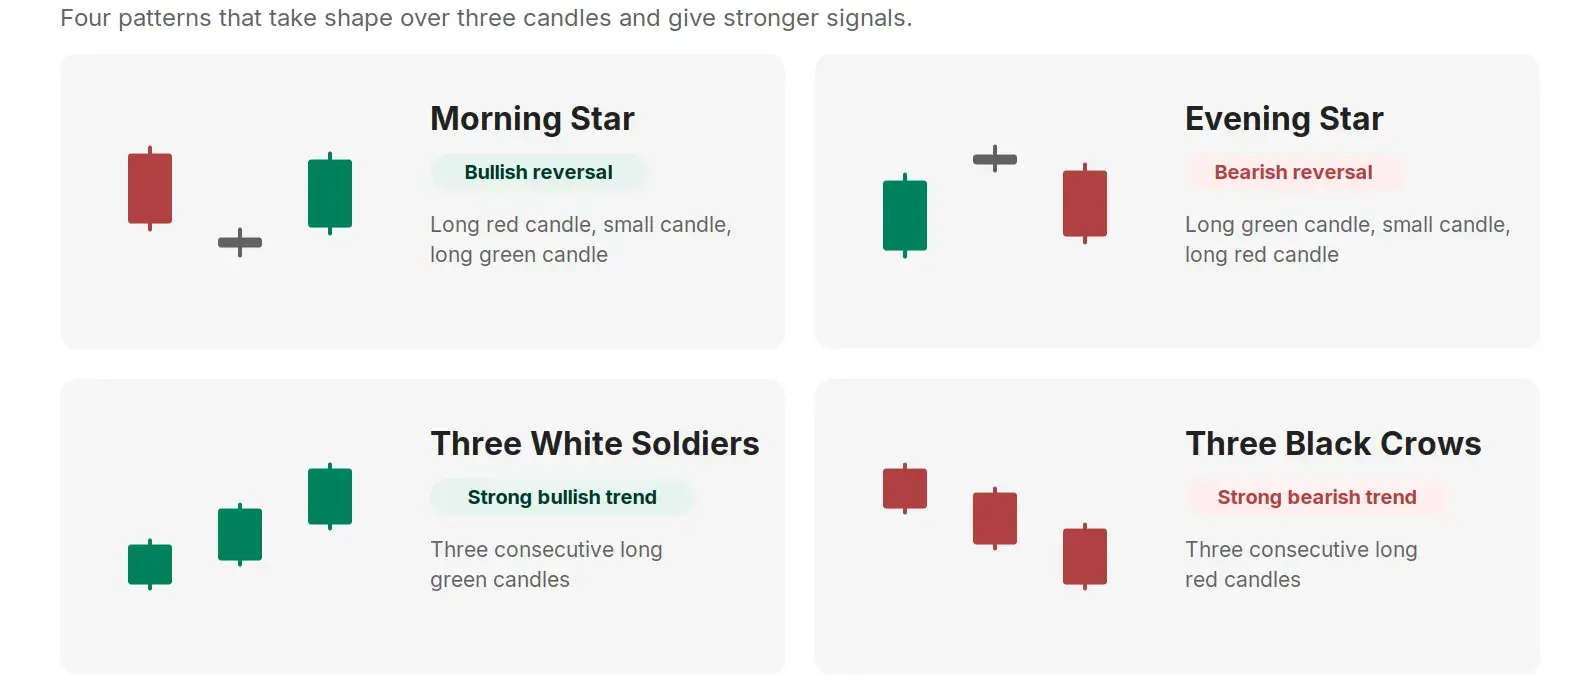
These patterns take shape over three candles and are considered stronger signals.
| Pattern | Formation | Signal |
| Morning Star | Long red candle, small candle, long green candle | Bullish reversal |
| Evening Star | Long green candle, small candle, long red candle | Bearish reversal |
| Three White Soldiers | Three consecutive long green candles | Strong bullish trend |
| Three Black Crows | Three consecutive long red candles | Strong bearish trend |
Why These Patterns Matter for Indian Traders
In Indian markets, be it Nifty, Bank Nifty, or individual stocks, there’s plenty of volatility everyday.
Candlestick patterns are widely used because:
- They are simple to identify visually, even for beginners
- They work across timeframes — from 5-minute intraday charts to weekly charts
- They give an early hint of possible trend reversals or continuations
- They can be combined with volume and other indicators for better accuracy
4 Important Points to Remember
There is no single candlestick pattern that guarantees a price move.
It’s always best to:
- Confirm patterns with the next candle’s movement
- Combine patterns with support/resistance levels
- Use them alongside indicators like moving averages or RSI
- Avoid trading on pattern signals alone, especially with high leverage
Conclusion
By understanding candlestick patterns, traders get access to a visual language to interpret market behavior.
Be it a beginner exploring intraday trading or someone building a long-term investing habit, recognizing these formations can add real value to a person’s trading decisions.
It is to be noted that candlestick patterns work best when combined with other tools. Hence, treat them as one part of a broader strategy rather than the sole basis for decisions.
|
Also Read |
|
| Types of Market Structure | |
| What is Leverage and Margin Trading | |
