

Candlestick charts are one of the most popular methods used by Indian traders and investors. These charts are used to read price movements on the NSE and BSE.
Once you learn candlestick anatomy, it helps you quickly judge whether buyers or sellers were in control during a specific time period, i.e. whether you’re looking at a 1-minute chart or a daily chart.
More about Candlestick
A candlestick is a visual representation of price movement for a stock, index, or commodity. This is for a fixed time period.
Each candle tells you four key prices for that period:
- Open – the price at which trading started
- High – the highest price reached
- Low – the lowest price reached
- Close – the price at which trading ended
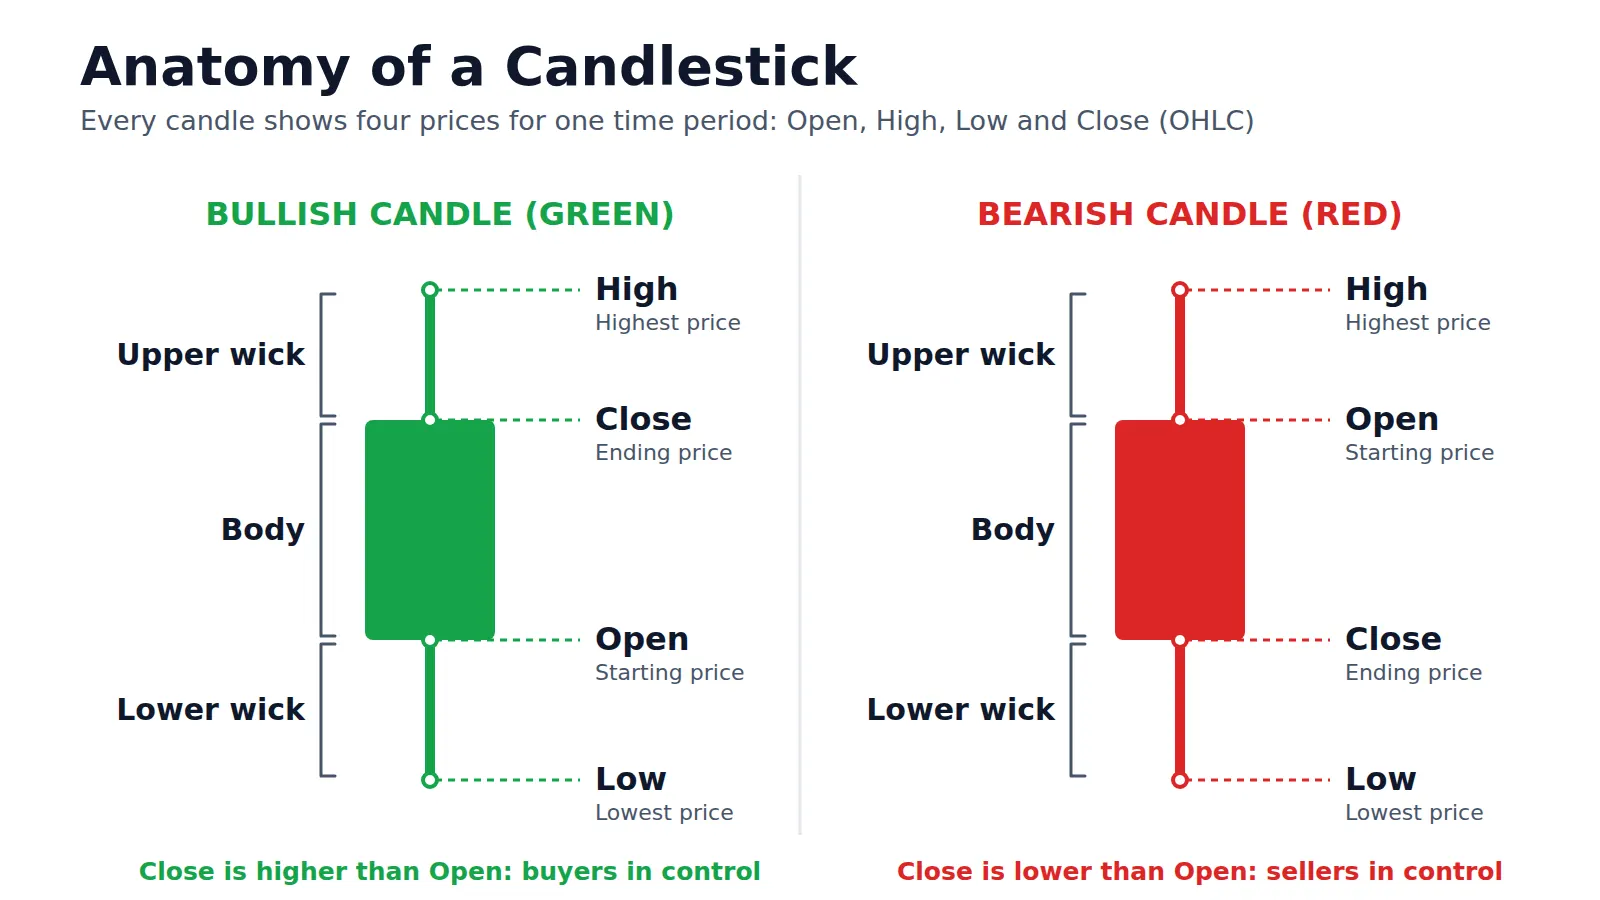
These four values are commonly called OHLC data, and they form the foundation of every candlestick you see on a trading screen.
The Two Main Parts of a Candle
Every candlestick has two visible components. They are the body and the wicks. Wicks are also known as shadows.
Both these components together constitute the full candlestick anatomy. Traders study this anatomy before making decisions.
1. The Body
The thick, rectangular part of the candle is called the body. It shows the range between the opening and closing price.
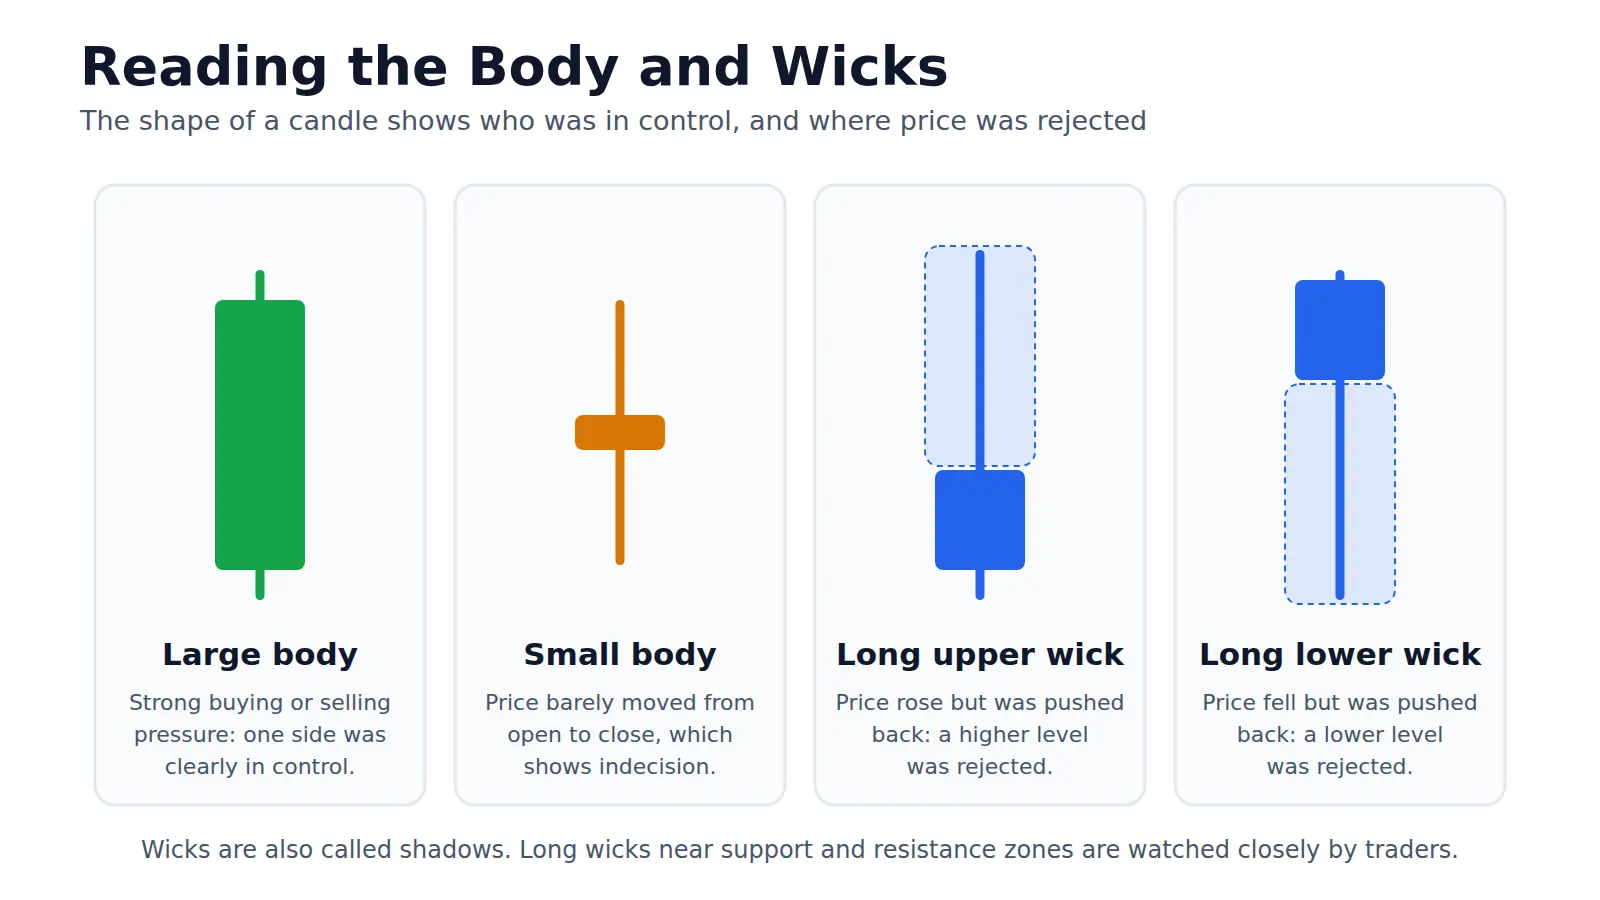
- A large body means strong buying or selling pressure
- A small body means the price barely moved, showing indecision
2. The Wicks (Shadows)
The thin lines above and below the body are the wicks.
They show the highest and lowest prices touched during that period, even if the price didn’t close there.
- Upper wick – distance between the high and the close (or open, for a red candle)
- Lower wick – distance between the low and the open (or close, for a red candle)
Long wicks often indicate rejection of a price level, which many Indian intraday traders watch closely around support and resistance zones.
Bullish vs Bearish Candles
| Feature | Bullish Candle (Green) | Bearish Candle (Red) |
| Meaning | Close is higher than open | Close is lower than open |
| Buyer/Seller control | Buyers dominated | Sellers dominated |
| Common colour | Green or white | Red or black |
| Market sentiment | Positive | Negative |
Note:
Some Indian trading platforms use blue and red, or hollow and filled candles, instead of green and red — always check your charting app’s colour settings before trading.
An Example with a Simple Diagram
Imagine a single trading session on Nifty:
- Open: ₹19,800
- High: ₹19,950
- Low: ₹19,750
- Close: ₹19,900
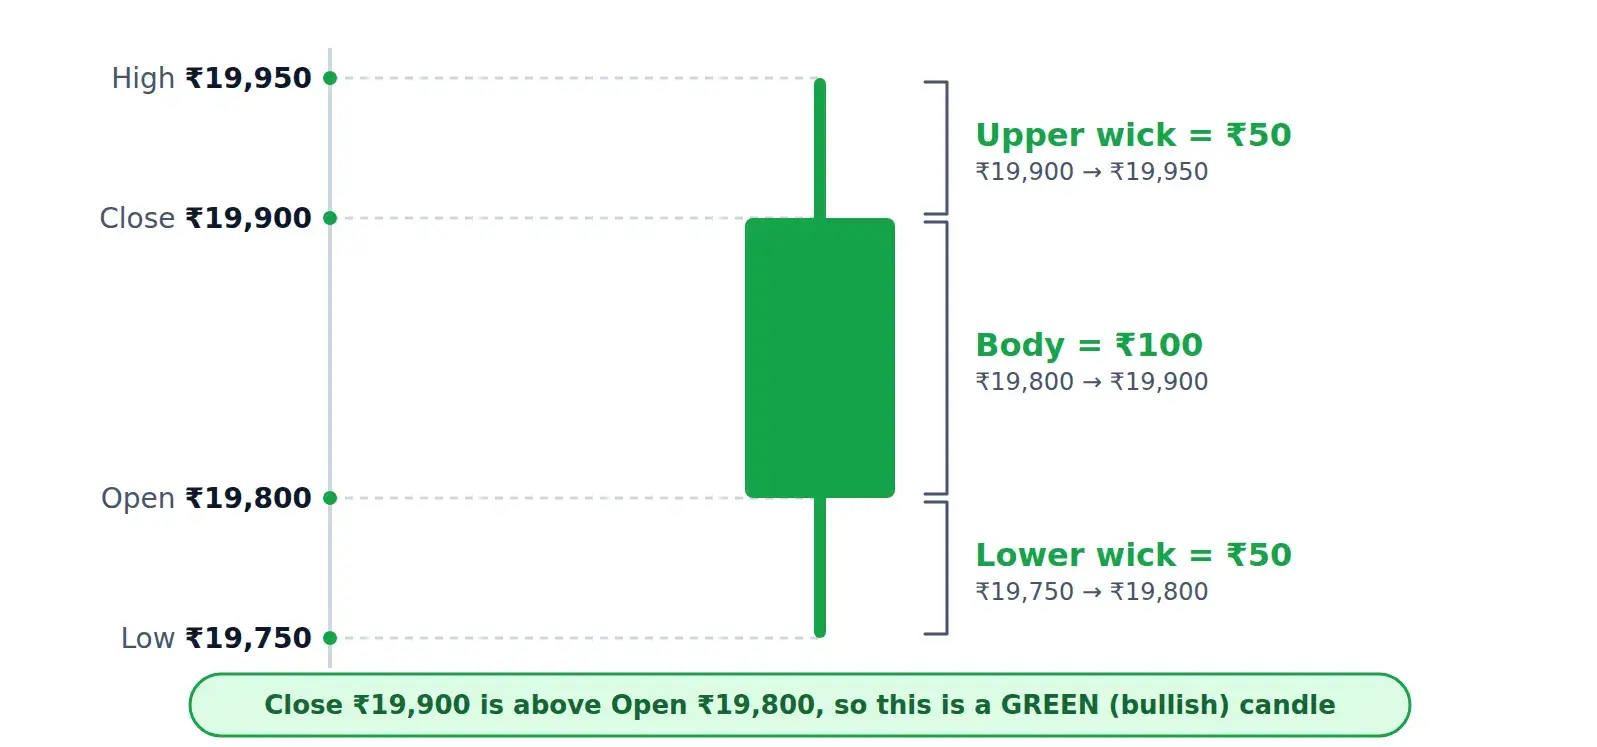
In the above example, since the close (₹19,900) is above the open (₹19,800), it forms a green candle.
The body stretches from 19,800 to 19,900.
The upper wick extends to 19,950, and the lower wick extends down to 19,750.
Importance of Candlestick Anatomy for Indian Traders
Learning the basics of candlestick anatomy is not only about theory. It directly helps in practical trading decisions such as:
- Spotting reversals near key support/resistance on stocks like Reliance, TCS, or HDFC Bank
- Reading market sentiment before Budget days or RBI policy announcements, when volatility spikes
- Combining with volume to confirm whether a move is genuine or a false breakout
- Building patterns — a single candle is the building block for patterns like Doji, Hammer, and Engulfing candles
Quick Recap Table
| Part | What it Shows |
| Open | Starting price of the period |
| Close | Ending price of the period |
| High | Highest price touched |
| Low | Lowest price touched |
| Body | Range between open and close |
| Wick | Range beyond the body (high/low) |
Final Thoughts
Once you are comfortable identifying the open, close, high, low, body, and wicks on a chart, you become an expert in the basics needed to move on to candlestick patterns and technical analysis.
This foundation applies regardless of whether you are tracking Nifty futures, Bank Nifty options, or individual stocks on your favourite Indian broking app.
|
Also Read |
|
| Types of Market Structure | |
| Types of Candlestick Patterns | |
| What is Leverage and Margin Trading | |
