

Open interest in options tells you how many option contracts are still live in the market at a given moment.
For beginners trading Nifty, Bank Nifty or stock options, it is one of the simplest ways to see where other traders are active.
Read it correctly, and it helps you judge liquidity, spot busy strikes and understand what price movement may be telling you.
What is Open Interest in Options?
Open interest (OI) is the total number of option contracts that have been opened but not yet closed, squared off or expired.
Think of it as a headcount of “live” contracts. Every options trade has two sides: a buyer and a seller.
When a new buyer and a new seller agree on a trade, one new contract comes into existence.
For example, Ravi buys one Nifty 25,000 Call option and Meera sells it to him.
Both are new to this strike, so open interest becomes 1. It stays at 1 until Ravi or Meera closes their position, or the contract expires.
Simple Example of Open Interest
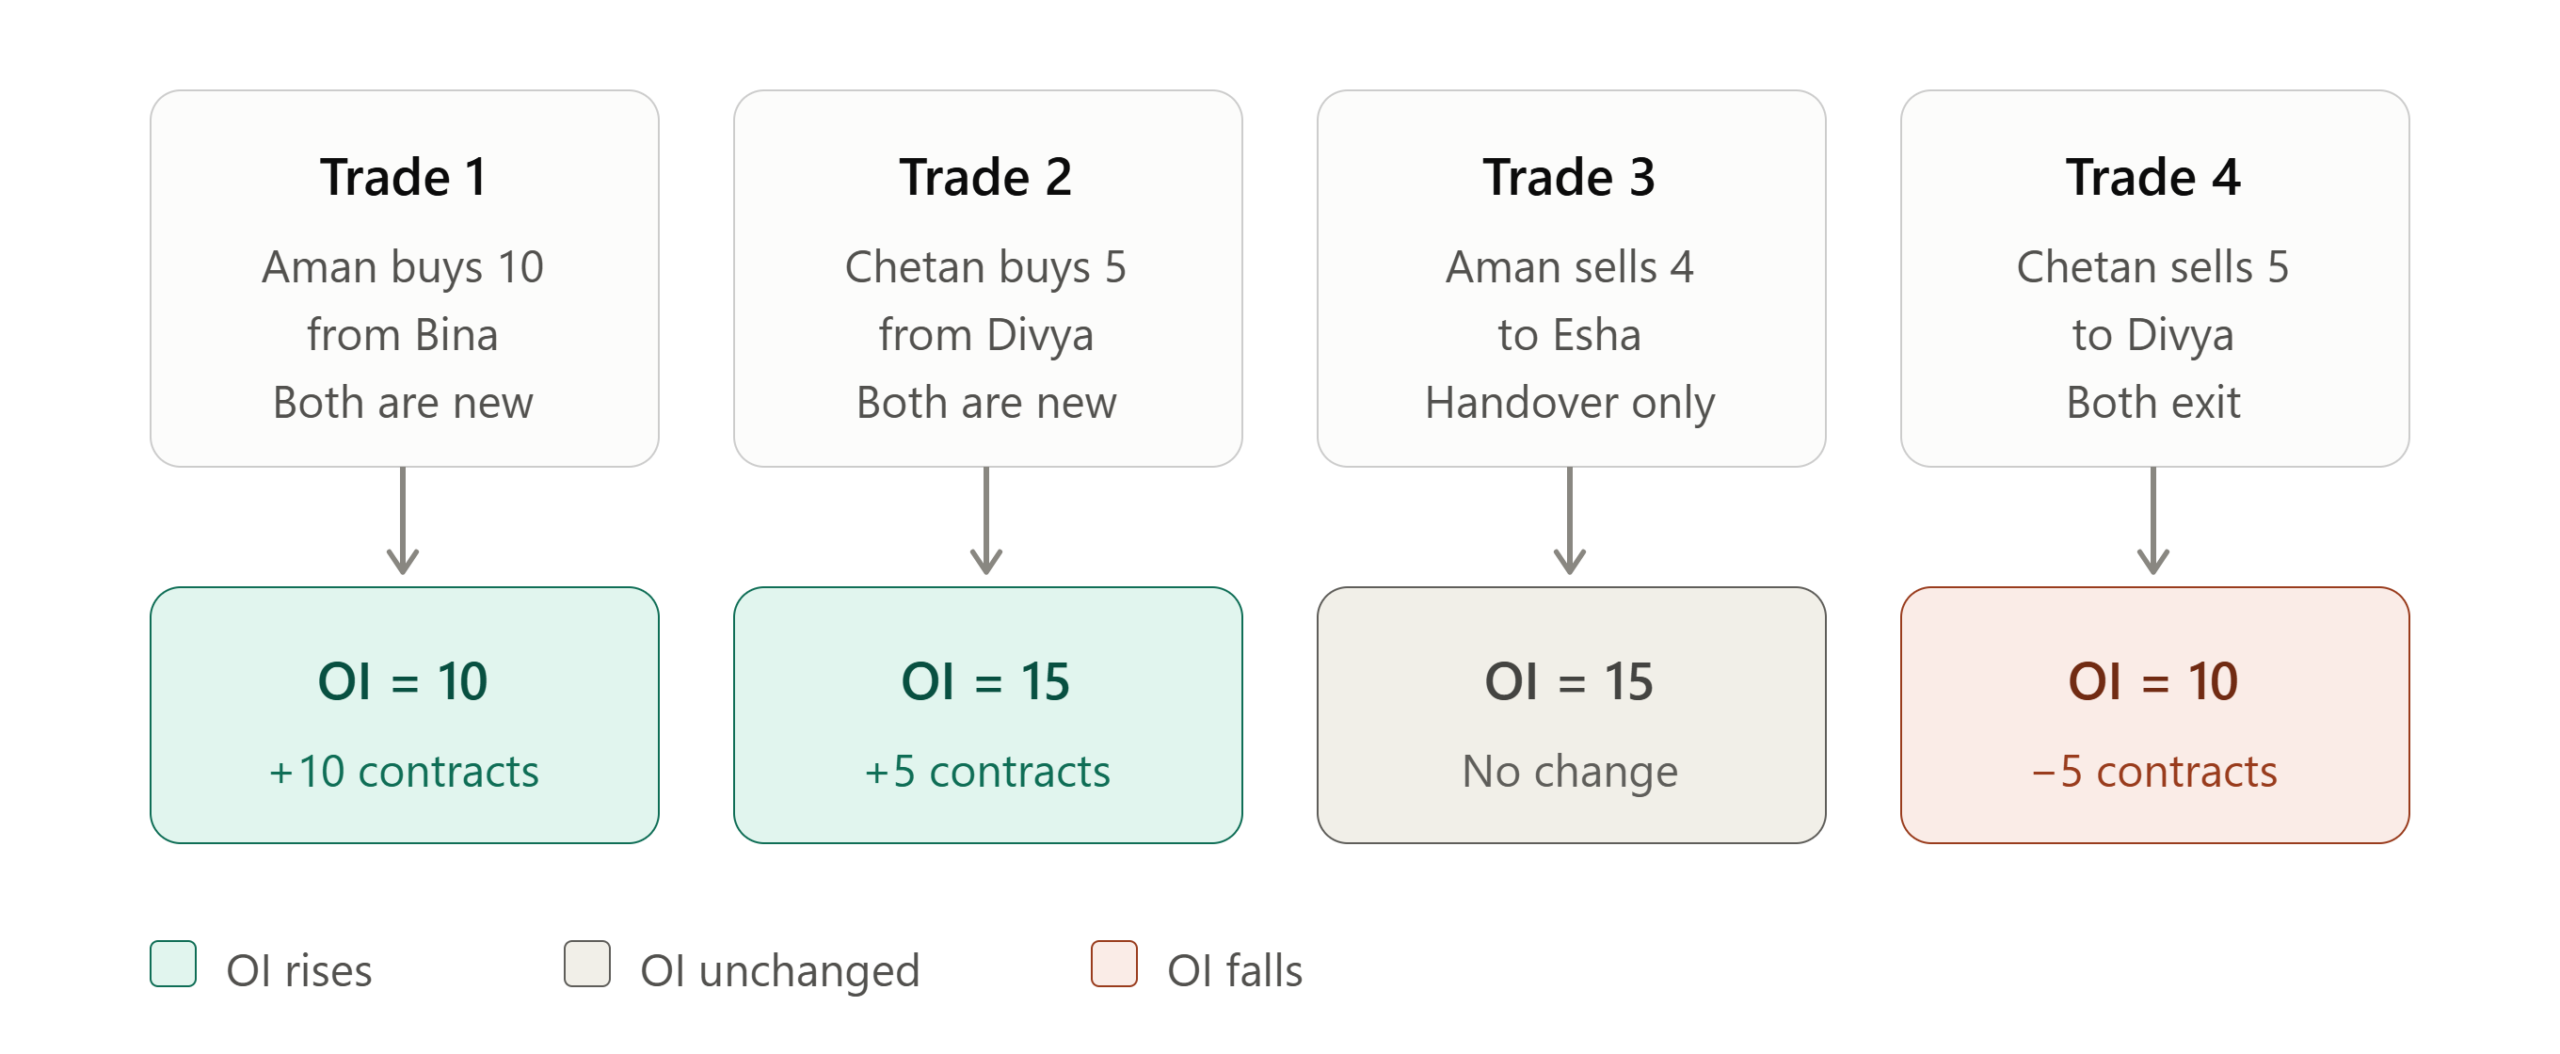
Let’s track one Nifty Call option through a single day. The numbers are illustrative.
- Aman buys 10 contracts from Bina. Both are new. OI rises to 10.
- Chetan buys 5 contracts from Divya. Both are new. OI rises to 15.
- Aman sells 4 of his contracts to Esha. Aman exits, Esha enters. One position moves from one person to another. OI stays at 15.
- Chetan sells his 5 contracts to Divya. Chetan exits and Divya closes her sold position. Two exits, so OI falls to 10.
The Lesson:
OI goes up only when new positions are created. It goes down when positions are closed. It stays flat when positions are simply handed over.
Open Interest vs Trading Volume
Beginners often mix these two up. Volume shows today’s activity, while OI shows total open positions.
| Aspect | Open Interest | Trading Volume |
| Meaning | Total live contracts not yet closed | Total contracts traded in a day |
| Daily reset | No. It carries forward from day to day | Yes. It starts from zero every session |
| What it indicates | How many positions are still open | How active trading was today |
| Example | In the example above, OI at day-end is 10 | Contracts traded: 10 + 5 + 4 + 5 = 24 |
So a strike can have high volume but low OI if traders open and close positions quickly within the day.
How does Open Interest Change?
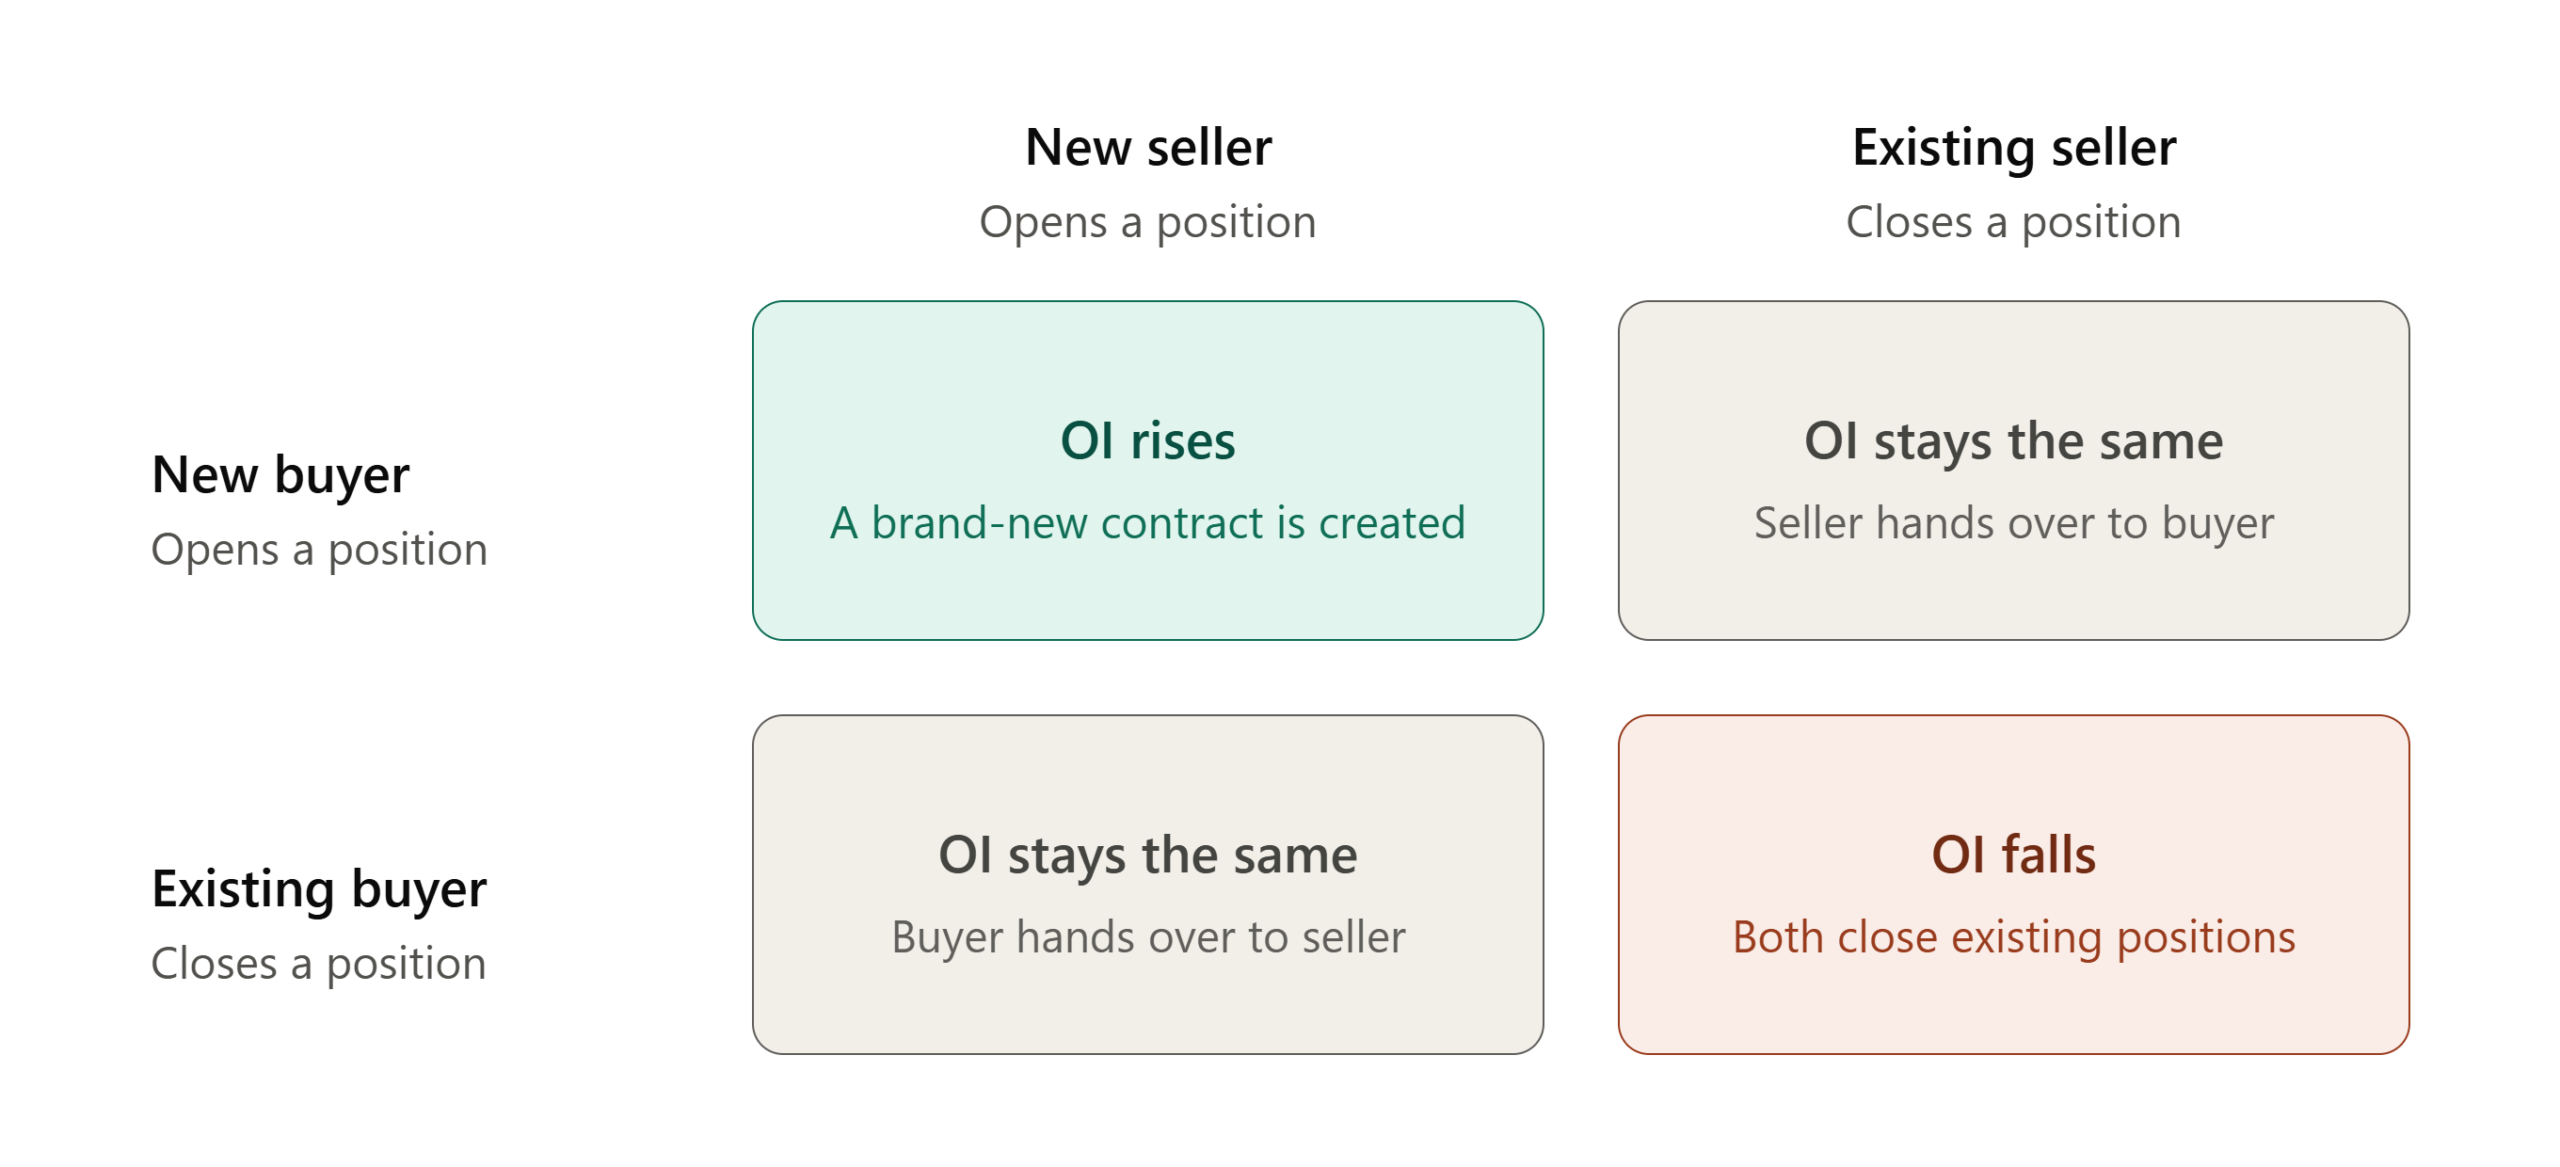
OI depends on whether buyers and sellers are new or existing. Buying or selling alone does not tell you the direction of OI.
| Buyer | Seller | Effect on OI |
| New buyer | New seller | Increases |
| Existing buyer exits | New seller enters | Stays the same |
| New buyer enters | Existing seller exits | Stays the same |
| Existing buyer exits | Existing seller exits | Decreases |
How to Read Open Interest with Price
Traders usually read OI together with price movement.
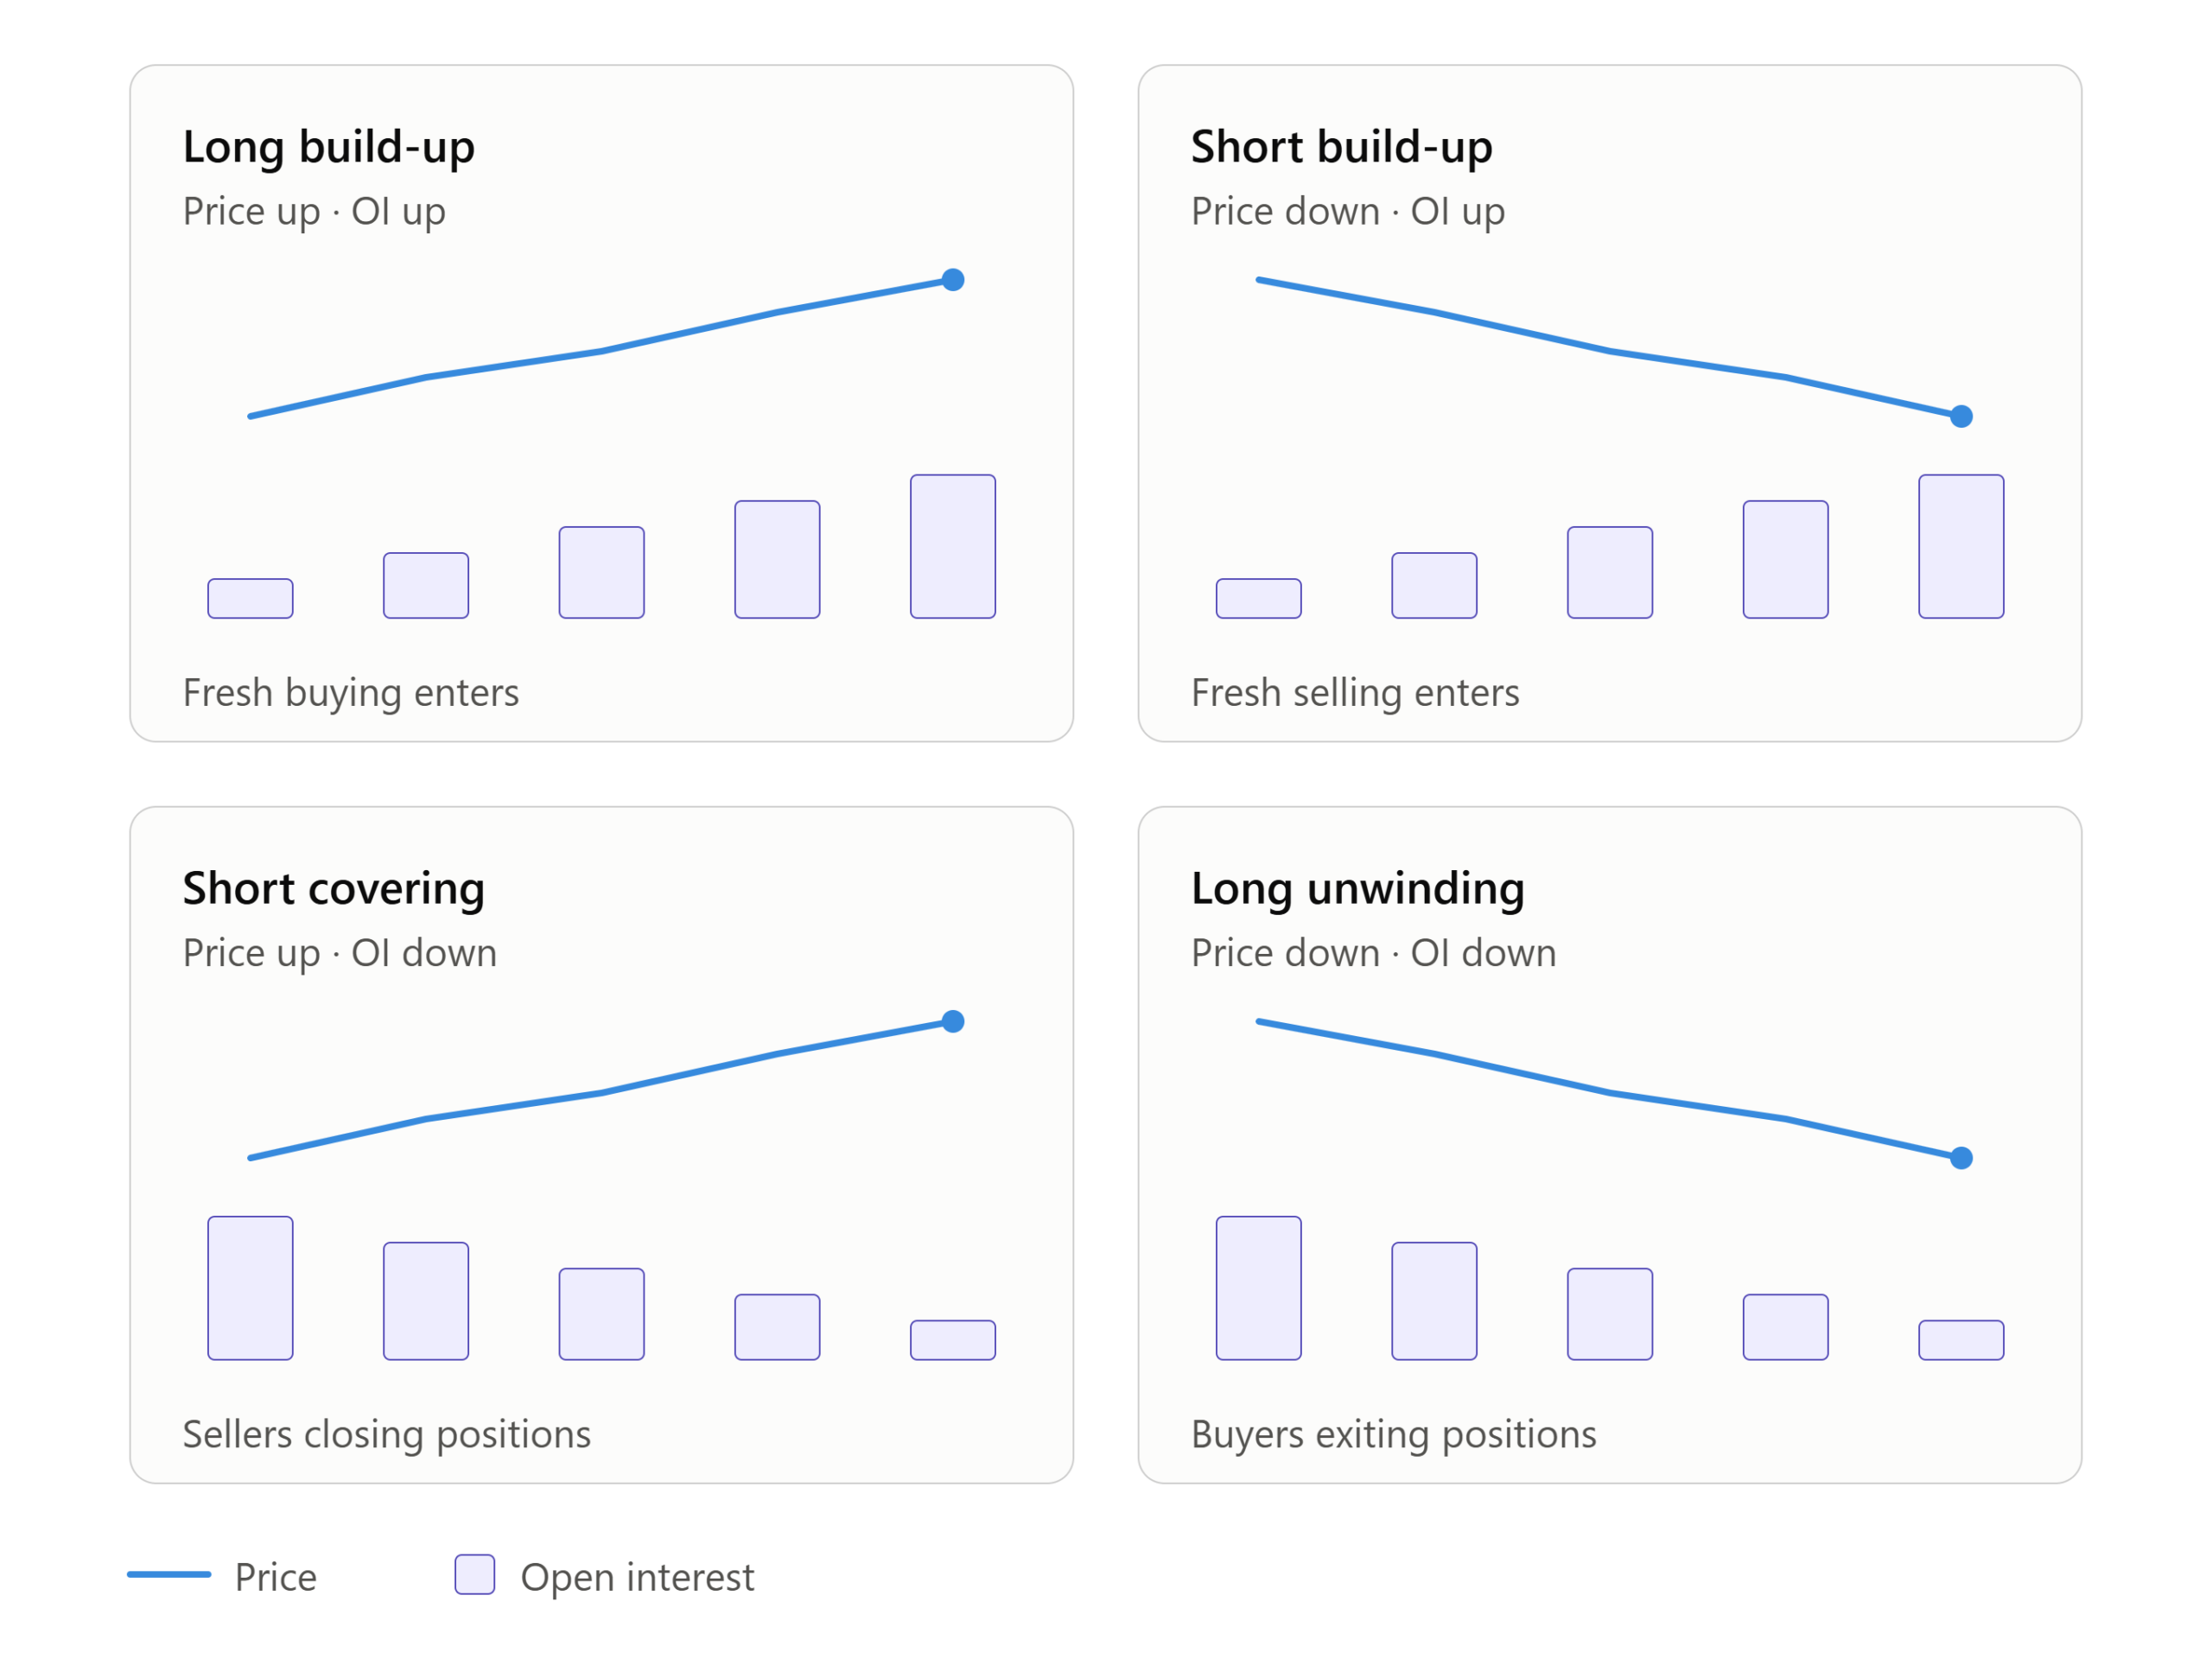
Here are the four common combinations, usually applied to the underlying Nifty, Bank Nifty or stock price.
| Price Trend | OI Trend | Likely Interpretation | Simple Meaning |
| Rising | Rising | Long build-up | Fresh buying is entering the market |
| Falling | Rising | Short build-up | Fresh selling is entering the market |
| Rising | Falling | Short covering | Sellers are closing positions |
| Falling | Falling | Long unwinding | Buyers are exiting positions |
Caution: These are indicators, not guaranteed signals. Markets can move against any pattern.
Why Open Interest Matters for Beginners
- Liquidity:
Strikes with higher OI usually have more participants, so entering and exiting is often easier.
- Possible support and resistance:
A strike with heavy Put OI is often watched as a possible support zone, and heavy Call OI as a possible resistance zone. These zones can shift quickly.
- Trend confirmation:
Rising OI along with a price move suggests more participants are backing that move.
- Change matters more than the number:
A big OI figure alone says little. Watching how OI rises or falls through the day tells you what is changing now.
Where to Check Open Interest in India
You can find OI in three common places:
- NSE option chain:
The NSE India website shows a free, live option chain for Nifty, Bank Nifty and stock options.
- Broker apps and trading platforms:
Most Indian brokers show an option chain inside their app.
- Options analytics tools:
Platforms such as Sensibull and Opstra present OI data in charts.On an option chain, Calls are usually on the left and Puts on the right.
The strike price sits in the middle column. Look beside each side for OI, Change in OI and Volume.
Change in OI shows how many contracts were added or removed compared with the previous day.
Common Mistakes Beginners Make
- Calling high OI bullish or bearish by itself. High OI only shows many open positions, not who is right.
- Ignoring price action. OI without price movement gives an incomplete picture.
- Comparing OI across different stocks. A large OI in one stock may be small for another. Compare against that stock’s own history.
- Over-relying on OI near expiry. Positions are squared off and rolled over quickly, so OI can change fast.
- Treating OI as a trading signal. Use it to understand the market, not as the only reason to trade.
Quick Recap
- Open interest is the total number of live option contracts.
- Volume shows today’s trading activity, while OI shows open positions.
- OI rises only when both the buyer and seller are new.
- Price and OI together give long build-up, short build-up, short covering and long unwinding.
- Change in OI is often more useful than the absolute number.
- OI is an indicator, not a prediction tool.
This tutorial is for educational purposes only. It is not financial advice, a stock recommendation, or a guarantee of profit.
