
Table of Contents
Data Analytics Case Studies show how companies use data. They turn big problems into clear solutions. You’ll see how data guides key decisions. These stories highlight real business challenges and outcomes. They show data’s role in everyday success. From healthcare to retail, results speak loudly. You’ll learn which tools bring results fast. These are not just stories—they are blueprints. Data Analytics Case Studies help you learn fast. They make data science practical and easy.
Companies today depend more on smart data use. Good insights lead to better choices. But how do they get there? That’s where case studies help. You’ll see tools, steps, and wins. Each case shows what really worked. Mistakes are lessons, and wins are models. These examples are full of tips to apply. Let’s explore them, one industry at a time.
Data Analytics Case Studies: Introduction
Data analytics helps turn raw data into insights. It supports smart decisions across every industry. Companies use it to solve daily business problems. But learning data tools isn’t always enough alone. We need examples to understand real-world usage. That’s where case studies become very useful. They connect theory with actions and results. They show what worked, how, and why.
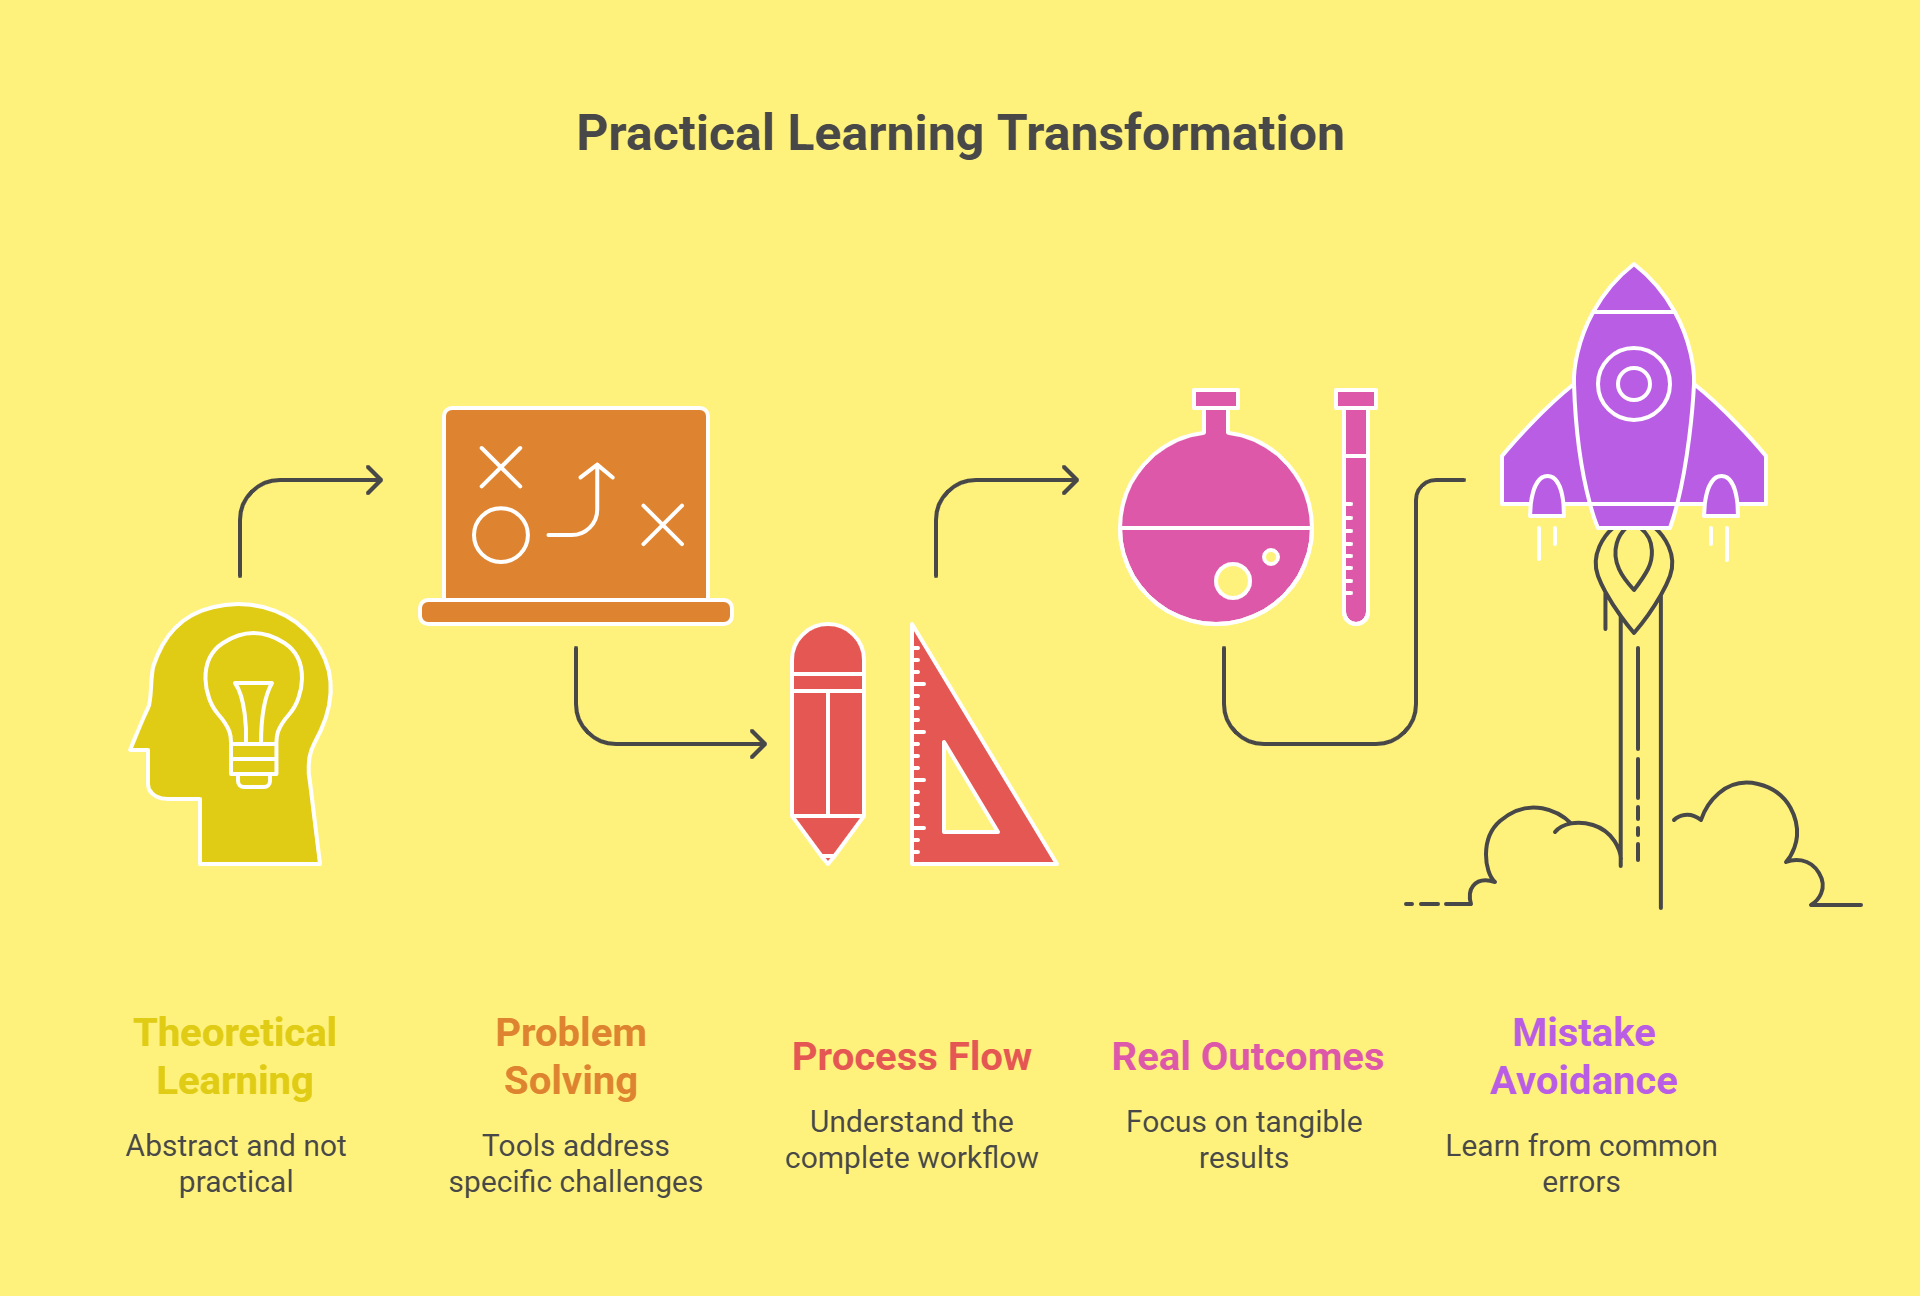
Why Real-World Case Studies Are Valuable
-
Make learning practical and easier
-
Show how tools solve specific problems
-
Help you see the full process flow
-
-
Show real outcomes, not just theory
-
Highlight changes in cost, speed, or quality
-
Include real data and measurable improvements
-
-
Reveal common mistakes and how to fix them
-
Help avoid errors in real business settings
-
Show how teams adapt and improve
-
What You Will Learn From This Blog
-
What case studies in data analytics mean
-
Industry-based success stories with key outcomes
-
Common data techniques used to solve problems
-
Lessons learned and best practices shared
-
Future trends shaping data analytics today
-
Helpful tools and links to go deeper
This guide is for learners, teams, and data beginners. Let’s dive into these powerful real-life examples.
What is a Data Analytics Case Study?
A data analytics case study shows how data helped. It explains a problem, the steps, and the result. It includes tools, techniques, and outcomes with details. Case studies are like storybooks for data learners. They show the full journey from data to decision. You can learn real methods from real situations. These stories make data easier to understand and apply.
Definition and Purpose
A data analytics case study is a real project example. It shows how teams solved a problem with data. The case includes the issue, tools, and final outcome. It connects theory with actions and measurable success.
Core Parts of a Case Study
| Part | Description |
|---|---|
| Problem Statement | The business challenge or issue faced |
| Data Collection | Where and how data was gathered |
| Tools and Techniques | What analytics methods or software were used |
| Solution | The steps taken using the data |
| Results | The impact seen in numbers or outcomes |
| Key Learnings | What others can learn from this case |
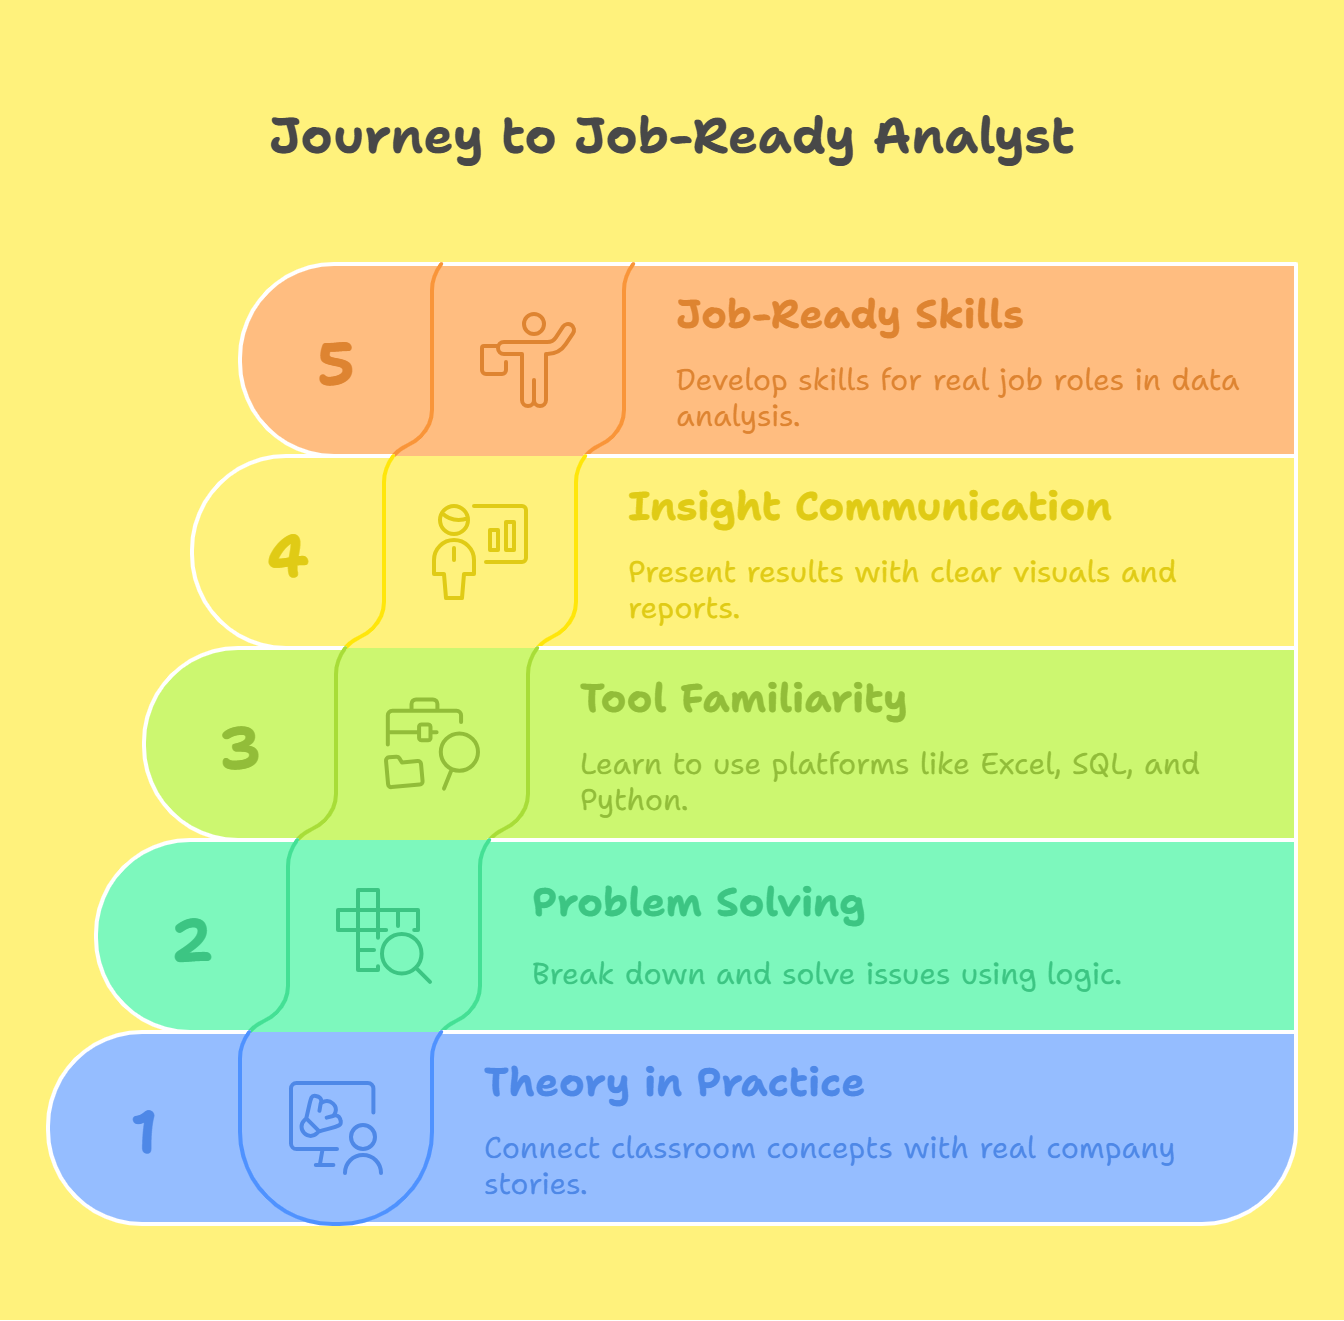
1. See How Theory Works in Real Life
-
Connects classroom concepts with real company stories
-
Helps you see why methods were chosen
2. Understand Problem Solving with Data
-
Breaks down each step clearly and simply
-
Shows how issues were solved using logic
3. Get Familiar With Real Tools and Terms
-
Introduces platforms like Excel, SQL, Python, etc.
-
Shows how these tools helped solve the problem
4. Learn to Present and Communicate Insights
-
Teaches how to show results with clear visuals
-
Helps with report-making and decision support
5. Build Skills for Real Job Roles
-
Cases reflect what analysts do at work daily
-
Makes you job-ready with real knowledge
Why It Matters for Learners
Reading a case is like working on a project. You understand the full journey, not just theory. It helps new learners think like data analysts. You start to ask questions like real professionals do. It’s one of the best ways to build confidence.
Industry-Wise Case Studies
Data analytics works across many industries today. Each industry uses data to solve its own problems. Case studies show how data creates real business value. Let’s explore success stories from six major industries. Each example shows problems, tools, and final results. We’ll also highlight lessons that others can follow. You’ll see data at work, step by step. These stories make learning more real and practical.
1. Retail & E-commerce
Retail stores and online shops collect customer data daily. They use it to improve sales, stock, and service. Analytics helps track what people buy and when.
Case Study: Walmart – Inventory Optimization
-
Problem: Overstock of some items, low stock of others
-
Approach: Analyze sales, seasons, and location patterns
-
Tools: SQL, SAS, data visualization dashboards
-
Result: Inventory costs reduced by 10%
-
Lesson: Accurate demand forecasting saves time and money
Case Study: Amazon – Customer Recommendations
-
Problem: Low engagement with random product suggestions
-
Approach: Use customer behavior to predict interest
-
Tools: Machine Learning, Python, recommender systems
-
Result: 35% of sales came from recommendations
-
Lesson: Personalization drives engagement and revenue
2. Healthcare
Healthcare needs data to improve patient safety and care. Hospitals track symptoms, test results, and treatment outcomes.
Case Study: Mount Sinai – Patient Risk Prediction
-
Problem: Hard to identify patients at high risk
-
Approach: Predict risks using patient history and data
-
Tools: Predictive modeling, R, Electronic Health Records
-
Result: 20% drop in emergency readmissions
-
Lesson: Predictive tools can save lives and costs
Case Study: NHS UK – Appointment No-Show Analysis
-
Problem: Missed appointments wasted time and money
-
Approach: Analyze past no-show patterns by region
-
Tools: Python, SQL, data visualization
-
Result: Reduced no-shows by 12% in six months
-
Lesson: Small changes based on data have big impact
3. Finance & Banking
Banks use data to manage risks and detect fraud. Analytics also helps them target better financial products.
Case Study: JPMorgan – Fraud Detection
-
Problem: Increase in digital fraud transactions
-
Approach: Build real-time detection models using past data
-
Tools: Machine learning, Python, anomaly detection
-
Result: Flagged 85% of fraud in real time
-
Lesson: Fast data action prevents huge financial losses
Case Study: American Express – Customer Retention
-
Problem: High customer churn rate noticed
-
Approach: Predict churn using transaction behavior
-
Tools: SAS, R, predictive analytics
-
Result: Retention rate improved by 15%
-
Lesson: Early warning systems keep loyal customers
4. Manufacturing
Factories use data to improve quality and reduce downtime. Analytics supports lean processes and equipment care.
Case Study: GE – Predictive Maintenance
-
Problem: Unexpected machine failure caused costly delays
-
Approach: Monitor sensor data to predict breakdowns
-
Tools: IoT, Big Data tools, real-time analytics
-
Result: 25% less downtime across all plants
-
Lesson: Maintenance data helps avoid expensive stoppage
Case Study: Toyota – Quality Control with Data
-
Problem: Hard to track quality issues in time
-
Approach: Use data at every production step
-
Tools: SQL, dashboards, automated alerts
-
Result: Product defects fell by 18%
-
Lesson: Real-time insights ensure better products
5. Marketing & Advertising
Marketing teams use data to reach the right audience. It helps improve ads, content, and overall strategy.
Case Study: Netflix – Content Recommendation
-
Problem: Too many shows, viewers confused
-
Approach: Recommend shows based on watch history
-
Tools: AI, collaborative filtering, Python
-
Result: 80% of views came from recommendations
-
Lesson: Personalized content keeps users watching
Case Study: Coca-Cola – Social Media Analysis
-
Problem: Unclear feedback from global customers
-
Approach: Analyze comments and posts online
-
Tools: Text analytics, sentiment analysis, R
-
Result: Quicker marketing responses and better product ideas
-
Lesson: Listening online builds better brand trust
6. Telecommunications
Telecom firms deal with millions of customers daily. Data helps reduce churn and manage network traffic.
Case Study: Verizon – Customer Churn Prediction
-
Problem: Losing many customers to competitors
-
Approach: Predict churn using usage and complaints
-
Tools: Decision trees, machine learning, Python
-
Result: Retained 10% more customers
-
Lesson: Knowing when users may leave brings solutions early
Case Study: AT&T – Network Optimization
-
Problem: Network lags during high usage hours
-
Approach: Analyze usage patterns across times and areas
-
Tools: Big Data tools, real-time dashboards
-
Result: 30% improvement in call and internet speed
-
Lesson: Smart planning improves service and satisfaction
These industry stories show data’s power in real life. Each case highlights smart tools, steps, and results. Learning from these helps build your own data skills.
Next, we’ll explore the techniques used in these cases.
Common Data Analytics Techniques Demonstrated
Data analytics uses many simple yet powerful techniques. These methods help solve problems in every industry. Let’s explore the most used techniques in our cases. We’ll see how each method solved a specific problem. These tools work across tools like Python, SQL, or Excel. Each technique adds value when applied with the right data.
1. Predictive Modeling
Predictive modeling finds patterns to guess future events. It uses past data to predict what comes next.
Where It Was Used
-
Healthcare: Predicted patient readmissions at Mount Sinai
-
Finance: Predicted customer churn at American Express
Steps Followed
-
Collected historical data and cleaned it
-
Trained models using machine learning tools
-
Tested and improved the prediction accuracy
Results
-
Reduced readmissions and kept more customers
-
Helped plan actions before problems occurred
2. Customer Segmentation
This technique groups people based on behavior or traits.
It helps target the right product to the right group.
Where It Was Used
-
Retail: Amazon used it for better product suggestions
-
Marketing: Netflix grouped users to improve watch time
Steps Followed
-
Tracked user actions and purchase history
-
Grouped users using clustering techniques
-
Tailored offers or content for each group
Results
-
Higher engagement and increased customer satisfaction
-
Boost in product views and conversions
3. Anomaly Detection
Anomaly detection spots unusual behavior in data sets.
It helps catch errors, fraud, or faults in systems.
Where It Was Used
-
Banking: JPMorgan used it to find fraud
-
Manufacturing: GE used it to detect machine faults
Steps Followed
-
Set rules for normal data ranges
-
Flagged data points outside expected behavior
-
Acted fast to prevent losses
Results
-
Found fraud before damage was done
-
Fixed issues before machines broke down
4. Sentiment Analysis
Sentiment analysis checks how people feel from text data.
It finds positive, negative, or neutral tones in messages.
Where It Was Used
-
Marketing: Coca-Cola used it on social media
-
Telecom: Used to analyze customer feedback messages
Steps Followed
-
Collected social comments and feedback
-
Applied Natural Language Processing (NLP) tools
-
Labeled words based on mood and opinion
Results
-
Understood customer views faster
-
Improved public response and service quality
5. Real-Time Analytics
This method tracks and responds to data instantly.
It works best for quick decisions and urgent actions.
Where It Was Used
-
Telecom: AT&T used it to optimize networks
-
Finance: JPMorgan used it for fraud alerts
Steps Followed
-
Connected systems to stream live data
-
Set up alerts for key triggers
-
Acted on results without delay
Results
-
Faster service with less downtime
-
Reduced losses from delayed actions
Technique Summary Table
| Technique | Used In | Key Benefit |
|---|---|---|
| Predictive Modeling | Healthcare, Finance | Anticipates problems before they grow |
| Customer Segmentation | Retail, Marketing | Improves targeting and engagement |
| Anomaly Detection | Finance, Manufacturing | Detects errors or fraud early |
| Sentiment Analysis | Marketing, Telecom | Understands customer opinions |
| Real-Time Analytics | Telecom, Finance | Enables fast decisions and actions |
Key Takeaways and Lessons Learned
Real-world case studies teach many practical lessons. They show what works and what to avoid. Across industries, some strategies were used often. These patterns help guide future analytics success.
Let’s explore themes, best practices, and early advice.
1. Recurring Themes from Case Studies
Some themes appeared in nearly every success story. They apply across industries, data sizes, and teams.
a. Data Quality Matters Most
-
Clean, complete data gave better results
-
Errors and gaps hurt model accuracy
-
Successful teams cleaned data before analysis
b. Clear Business Goals Help Focus
-
Top results came from goal-driven analytics
-
Teams asked, “What problem are we solving?”
-
They stayed focused on solving that problem
c. Team Collaboration Boosts Success
-
Analysts worked with business teams closely
-
Shared knowledge helped choose the right models
-
Communication led to smarter, faster decisions
d. Start Small, Then Scale
-
Many case studies began with pilot tests
-
Proved value fast before big investments
-
Helped get buy-in from all teams
2. Best Practices for Analytics Projects
Teams followed steps that helped them succeed faster. These best practices apply to all industries.
a. Define Clear Metrics Early
-
Set success benchmarks from the beginning
-
Used metrics to measure impact later
b. Use the Right Tools
-
Picked tools based on team skillsets
-
Chose platforms that scaled with data growth
c. Keep Models Simple
-
Avoided complex models without real need
-
Focused on explainable, reliable models
d. Test, Learn, Improve
-
Validated models with test data
-
Used results to improve and relaunch
3. Pitfalls to Avoid
Even top companies faced common mistakes. Learning from them saves time and cost.
a. Ignoring Data Prep
-
Poor data led to weak insights
-
Cleaning and organizing data was skipped
b. Overlooking End Users
-
Created dashboards users never used
-
Failed to align tools with actual needs
c. Relying Too Much on Tools
-
Let software make all decisions
-
Forgot to question results and logic
d. Not Updating Models
-
Used the same model for years
-
Ignored new data and trends
4. Tips for New Analytics Teams
Starting from scratch? Begin with these safe steps. These tips make early wins easier to achieve.
a. Train Your Team
-
Upskill with data tools like Excel or Python
-
Learn key concepts like cleaning and modeling
b. Choose a Small, Clear Problem
-
Don’t try to solve everything first
-
Pick one useful, simple business question
c. Partner with Business Units
-
Involve sales, ops, or customer teams
-
Build trust by solving their pain points
d. Track Outcomes, Not Just Outputs
-
Focus on business gains, not just dashboards
-
Show results like revenue or cost savings
Summary Table: Lessons and Actions
| Lesson | Action to Take |
|---|---|
| Good data drives good results | Clean and organize before modeling |
| Goals give projects direction | Set clear problems to solve |
| Tools support, not lead | Use tools to assist, not replace thought |
| Small wins lead to big growth | Start with simple, testable projects |
| Teams win together | Involve every key business group |
Future Trends in Data Analytics
The data analytics world is growing very fast. New tools and methods appear every single year. Future case studies will look very different soon. Let’s explore trends shaping data analytics going forward. Each trend opens new ways to gain business value. These shifts will impact how problems get solved.
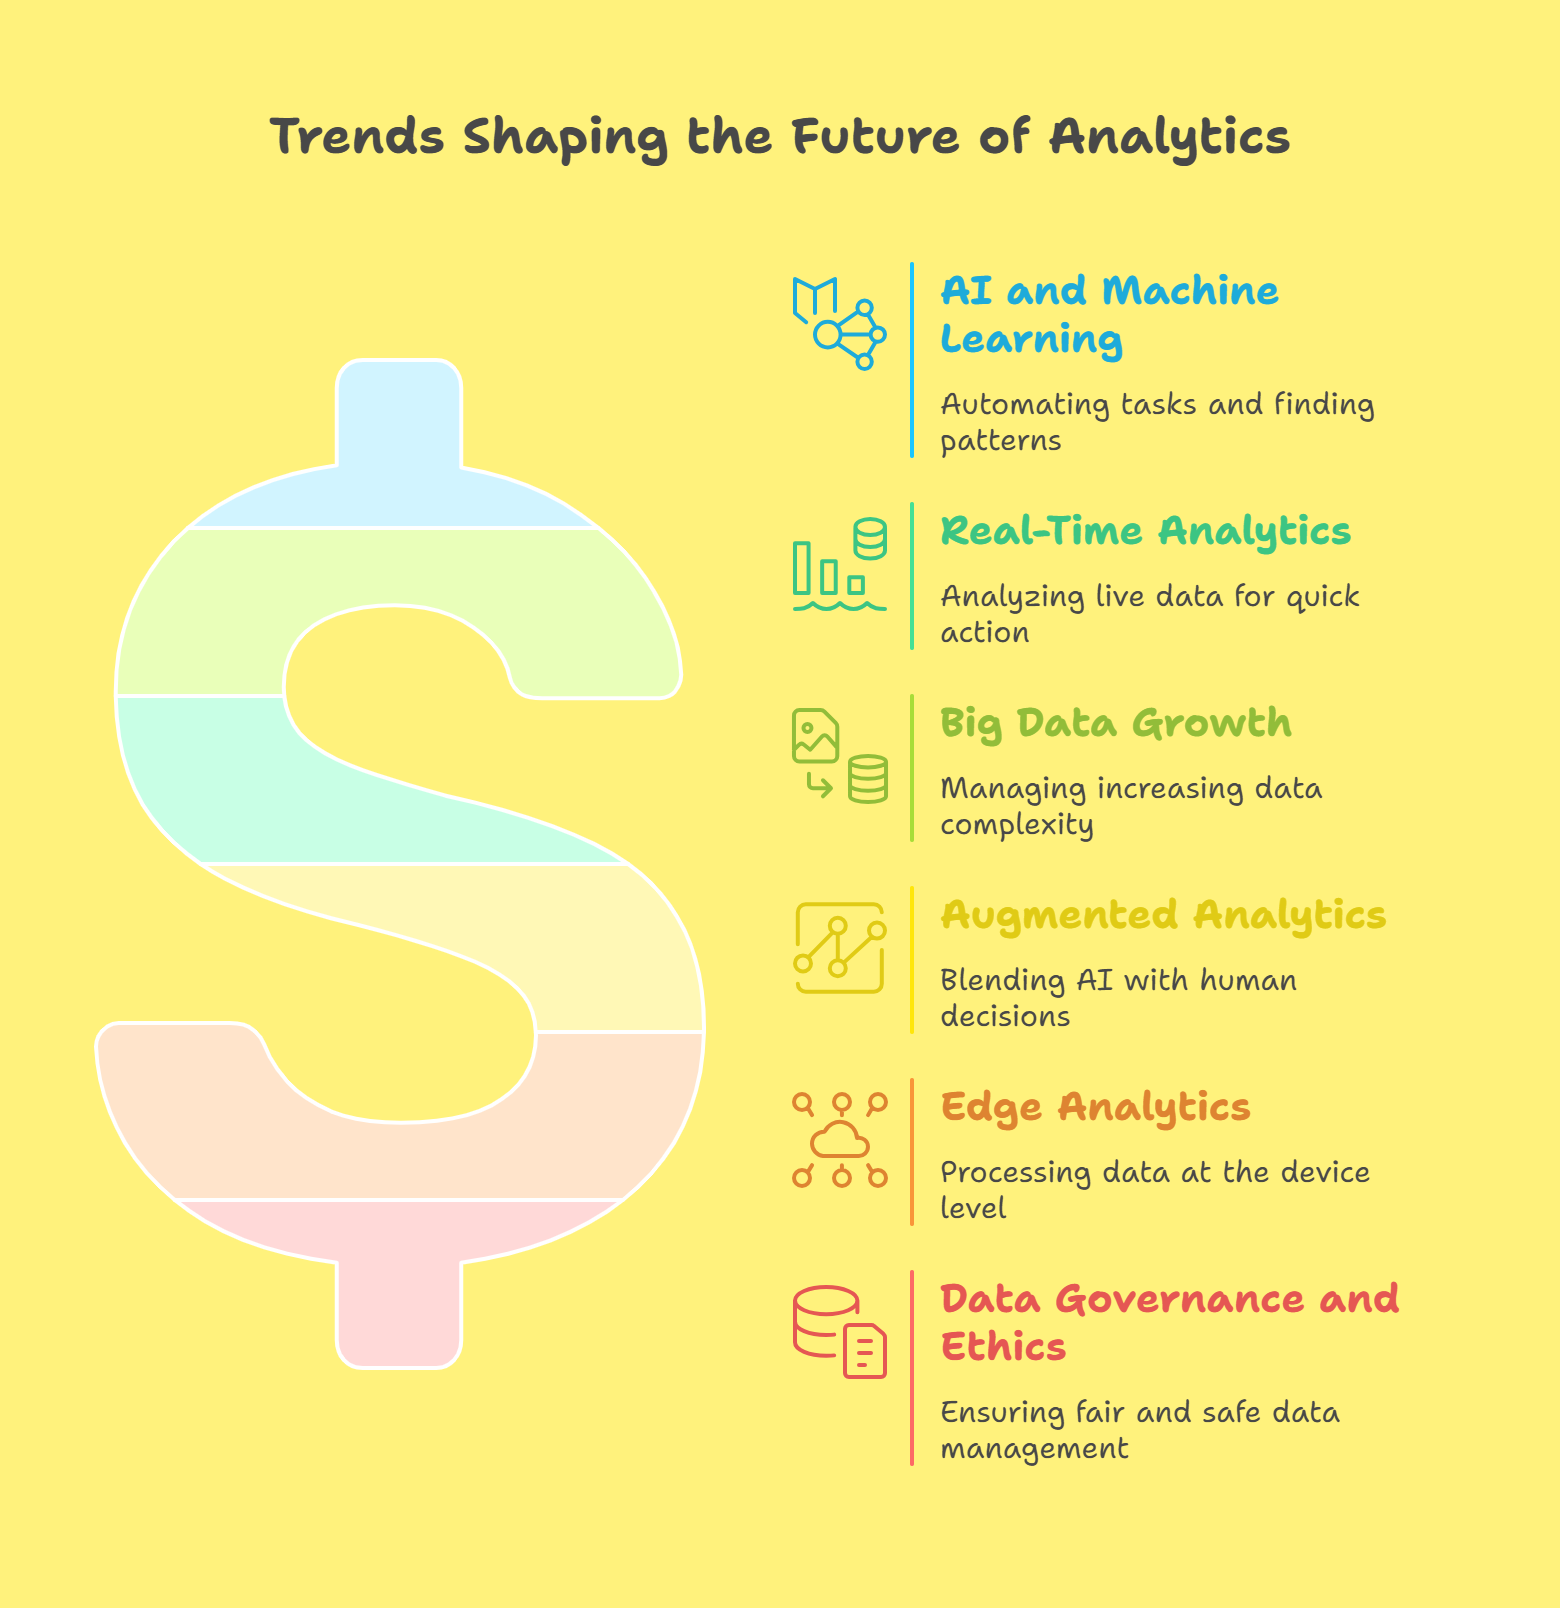
1. Artificial Intelligence (AI) and Machine Learning (ML)
AI and ML are leading the analytics future. They help automate tasks and find deeper patterns.
What’s Changing
-
Models learn from data without much coding
-
AI makes predictions faster and more accurately
-
Chatbots and AI tools assist business decisions
Impact
-
Case studies will use more AI models
-
Less manual effort, more intelligent automation
-
Faster decision-making and customer support
2. Real-Time Analytics
Real-time tools analyze live data instantly. They help take fast action without waiting hours.
What’s Changing
-
Sensors send data every second
-
Dashboards update in real time
-
Alerts are triggered by live events
Impact
-
Used more in telecom, banking, and logistics
-
Stops problems before they grow too big
-
Better customer experience with quick fixes
3. Big Data Growth
Data is growing in size and variety. More devices and sources mean more complex data.
What’s Changing
-
Companies gather data from more platforms
-
Structured and unstructured data are combined
-
Cloud storage enables easier data access
Impact
-
Case studies will include bigger datasets
-
Analytics will focus on speed and scale
-
Need for strong tools like Hadoop or Spark
4. Augmented Analytics
This trend blends AI with human decisions. It helps explain results and guide next steps.
What’s Changing
-
Tools suggest insights automatically
-
Visuals highlight trends with smart suggestions
-
Less guesswork, more clarity for all users
Impact
-
More accessible for non-data experts
-
Faster insight discovery without coding skills
-
Better collaboration between teams
5. Edge Analytics
Edge analytics works at the device level. It brings analytics closer to the data source.
What’s Changing
-
IoT devices process data on the spot
-
No need to send data to central servers
-
Fast action at the point of need
Impact
-
Useful in smart cities and manufacturing
-
Reduces delay in time-sensitive systems
-
More efficient and cost-saving processes
6. Data Governance and Ethics
More data means more rules and responsibilities. Companies must manage data fairly and safely.
What’s Changing
-
New laws like GDPR shape data use
-
More focus on consent and privacy
-
Data ethics is now a key concern
Impact
-
Case studies will include ethical challenges
-
Success means more than just good results
-
Trust and compliance become top priorities
Trend Summary Table
| Trend | Key Benefit | Where It Helps Most |
|---|---|---|
| AI & ML | Smart automation and deeper insights | All industries |
| Real-Time Analytics | Faster reactions and better decisions | Telecom, banking, logistics |
| Big Data | Handles volume, variety, and speed | Retail, healthcare, finance |
| Augmented Analytics | Easier use for all teams | Marketing, operations |
| Edge Analytics | Local data processing and action | IoT, smart tech, manufacturing |
| Data Ethics | Builds trust and ensures compliance | Government, healthcare, finance |
Resources and Further Reading
Entri offers a rich collection of blog posts, tutorials, and guides focused on data analytics and related careers. These resources help learners at all levels deepen their skills and knowledge with practical insights and easy-to-follow content.
📚 Blogposts
Explore expert advice, career tips, and project ideas to build your data analytics skills:
-
How to Build a Portfolio for Data Analyst
Learn how to create a strong portfolio showcasing your analytics projects. -
How to Become a Data Analyst
Understand the essential skills and career path of a data analyst. -
Top Data Analytics Interview Questions & Answers
Prepare for interviews with common questions and effective answers. -
What is Data Science? Introduction and Career Guide
Get an overview of data science roles and opportunities.
🛠️ Tutorials and Learning Guides
Step-by-step tutorials and course overviews to build practical analytics skills:
-
Data Analytics Tutorial for Beginners
A simple guide covering data analysis basics and tools. -
SQL Tutorial for Data Analytics
Learn SQL fundamentals essential for querying data. -
Excel for Data Analytics
Master Excel techniques to analyze and visualize data effectively. -
Python for Data Analytics
An introduction to using Python for analytics projects.
📄 Whitepapers and Guides
Detailed guides and industry insights to help understand trends and applications:
-
Data Analytics Career Guide
In-depth information about career opportunities and growth areas. -
Complete Guide to Data Analytics Tools
Overview of popular tools and software in analytics. -
How to Prepare for Data Analytics Certifications
Tips and strategies for earning industry-recognized certificates.
Using these Entri resources, you can build strong foundations, stay updated on industry trends, and prepare for a successful career in data analytics.
Call to Action (CTA)
Ready to elevate your data analytics journey? Explore Entri’s curated resources designed to enhance your skills and career prospects.
Stay Updated with Entri Blog
Stay informed with the latest trends, tutorials, and career tips in data analytics. Explore Entri’s blog and receive regular updates directly to your inbox.
Access Free Data Analytics Resources
Enhance your knowledge with Entri’s comprehensive resources, packed with insights valuable for data enthusiasts.
Explore Entri’s Data Analytics Course
Seeking structured learning in data analytics? Entri offers an online course with expert support to help you navigate your learning path and career decisions.
Take the next step in your data analytics journey with Entri’s expert resources and support.
Conclusion
Data analytics drives real change across industries. Case studies show success through smart decisions. Each example offers lessons and fresh ideas. Techniques like modeling and segmentation solve problems. Organizations gain value from insights and trends. Future tools will boost real-time decisions fast. Learning from others builds strong data strategies. Start your journey with trusted resources like Entri.
Frequently Asked Questions
What is a data analytics case study?
A data analytics case study is a detailed analysis of how data was used to solve a real-world problem. It covers the problem, analytics approach, tools used, and outcomes. Case studies show the real impact of analytics across industries. They help learners understand how theory applies in practice.
Why should I learn through case studies?
Case studies offer practical insights you can’t get from theory alone. They show how analytics solves real problems with real data. You’ll see the exact tools and steps used. This helps build confidence and job-ready skills.
Which industries use data analytics most?
Data analytics is used in almost every industry today. Top examples include retail, healthcare, finance, manufacturing, marketing, and telecom. Each industry uses data differently to gain insights, cut costs, and improve decisions. Case studies highlight these unique approaches.
What tools are commonly used in these case studies?
Common tools include Excel, Python, R, SQL, and Tableau. These tools help in collecting, cleaning, analyzing, and visualizing data. Machine learning models and BI tools are also used. The choice depends on the industry and problem type.
What techniques were highlighted in the blog's case studies?
Key techniques include customer segmentation, predictive modeling, and anomaly detection. Each method helps solve a specific kind of problem. For example, segmentation helps in targeted marketing. Predictive models assist in demand forecasting or fraud detection.
Can beginners understand these case studies?
Yes, the case studies in the blog use simple language and clear steps. They explain problems, tools, and results in easy terms. Beginners can understand the approach and learn the logic. These are ideal for learners with basic data knowledge.
What are the main lessons from these case studies?
Some key lessons include using the right data, starting with clear goals, and choosing simple tools first. Team collaboration and testing models early also matter. Results improve when decisions are data-driven. Small steps often lead to big insights.
How can my organization benefit from case study learnings?
Organizations can adopt similar methods and tools from the case studies. They can avoid common mistakes and follow proven strategies. Learning from real examples saves time and cost. It also guides better planning and implementation.
What trends will shape future case studies?
Emerging trends include AI, real-time analytics, and big data. More companies now use automated tools and cloud platforms. Future case studies will show faster decisions and deeper personalization. Staying updated is key to staying ahead.
How do case studies help in career growth?
Case studies build your problem-solving and critical thinking skills. They show how analytics is applied in real jobs. Recruiters value candidates who understand real-world workflows. Practicing with case studies prepares you for interviews and on-the-job tasks.


