Table of Contents
Key Takeaways:
- A performance marketing dashboard helps you visualise ad spend, traffic, conversions, and ROI in one place.
- Build your dashboard in Google Sheets by gathering data, defining KPIs, designing the layout, visualising metrics, and automating updates.
- Choose the right metrics (CPM, CPC, CPA, ROAS etc.) and avoid “vanity metrics” that don’t drive decisions.
- Use Sheets functions like IMPORTDATA, QUERY, pivot‑tables and charts to make the dashboard functional and dynamic.
- For deeper learning, consider taking the Entri App’s AI‑powered Digital Marketing Course, which covers dashboards, analytics and campaign measurement in detail.
Introduction
In today’s digital marketing world, campaigns across Google Ads, Facebook / Meta, LinkedIn, email and other channels generate masses of data. But raw data doesn’t help unless you see the story behind it. That’s where a performance marketing dashboard comes in: a single sheet where you track your spend, channel performance, conversion data and ROI, enabling quick decisions and optimisation.
If you’re a marketing aspirant in India, a working professional in Kochi or anywhere globally, or someone looking to bridge campaign performance and measurement, this guide is for you. You don’t need to invest in expensive BI tools initially; you can start with Google Sheets, which is free, cloud‑based and familiar.
Over the next sections, we’ll walk through how to build a performance marketing dashboard in Google Sheets, from setup to data import to visualisation to automation.
Join Our Online Digital Marketing Course & Learn the Fundamentals!
Define Your Dashboard Goals & Audience
1: What is the primary goal of SEO (Search Engine Optimization)?
Before diving into cells and charts, ask: What do I want the dashboard to achieve? And who will use it?
Why this matters
- If you’re reporting to a business owner or client, they want high‑level metrics (e.g., total spend vs revenue, ROAS, cost per acquisition).
- If you’re using it internally as a campaign manager, you may want channel‑wise breakdowns, day‑by‑day spend and trends, and alerts when KPIs cross thresholds.
- Defining the goal ensures you don’t overload the sheet with unnecessary data. Many dashboards fail because they include too many vanity metrics.
Considerations for Indian / regional context
- Make sure currency conversions (INR vs USD) are handled if you’re managing campaigns globally.
- Make your audience global‑friendly: for example, show both “Cost per Click (CPC)” and “CPC (₹)” if your campaign is in India.
- Keep layout mobile‑view friendly: many users access Google Sheets on mobile.
Action step
Write down 2‑3 key questions your dashboard must answer. For example:
- “Which channel gave lowest CPA this month?”
- “What’s our ROAS (return on ad spend) for Indian campaigns in the last 7 days?”
- “Are we under‑ or overspending budget compared to plan?”
Once you have these, you’ll know what metrics to include (see next section).
Become an AI-powered Digital Marketing Expert
Master AI-Driven Digital Marketing: Learn Core Skills and Tools to Lead the Industry!
Explore CourseChoose Your KPIs (Key Performance Indicators)
Selecting the right KPIs is crucial. The metrics you track should align with your objectives, whether it’s lead generation, e‑commerce sales, brand awareness or app installs.
Common performance marketing KPIs
Here are the typical ones to include:
- Impressions: How many times your ad was shown.
- Clicks: Number of clicks (or taps) your ad received.
- Click‑through rate (CTR) = Clicks ÷ Impressions × 100.
- Cost: Total spend over the period (in ₹ or $).
- Cost per click (CPC) = Cost ÷ Clicks.
- Conversions: Number of desired actions (leads, sales, sign‑ups).
- Cost per acquisition (CPA) = Cost ÷ Conversions.
- Revenue / value: Total revenue generated by the conversions.
- Return on ad spend (ROAS) = Revenue ÷ Cost.
- Conversion rate (CVR) = Conversions ÷ Clicks × 100.
- Budget vs actual spend: To track adherence to the budget.
As one article puts it: “The second step in building your Google Sheet dashboard is identifying your KPIs.”
Avoiding vanity metrics
Metrics like “page views” or “time on site” may look interesting, but unless they tie to business outcomes, they might distract. Focus on what drives revenue or leads.
Aligning with your goal
If your goal is app installs, you might include “installs”, “cost per install (CPI)”, and “install to in‑app event conversion rate”. Adjust accordingly.
Action step
Create a “Metrics List” tab in your Google Sheet and list each KPI with a brief definition and target value if available. For example:
| KPI | Definition | Target |
| CPA | Cost ÷ Conversions | ₹200 |
| ROAS | Revenue ÷ Cost | ≥ 4× |
Gather & Import Your Data
With KPIs defined, the next step is sourcing the data. Options range from manual entry to full automation.
Data sources
You might pull from:
- Google Analytics or GA4
- Ad platforms: Google Ads, Meta Ads Manager, LinkedIn, Twitter, etc.
- CRM or lead‑generation tools
- Spreadsheets exported from campaigns
- CSV/Excel files
Methods of import
- Using built‑in Google Sheets functions like IMPORTDATA, IMPORTRANGE or IMPORTXML.
- Using add‑ons or third‑party tools (e.g., Supermetrics, Coefficient) to pull data from ad platforms.
- Manual copy‑paste (for small campaigns or quick setup).
Setting up your sheet structure
- Raw Data Tab(s): Keep one or more tabs where each row is one campaign/day/channel with relevant columns (date, channel, impressions, clicks, cost, conversions, revenue).
- Lookup / Cleaned Data Tab: Use formulas or queries to clean or aggregate raw data (e.g., by week or month).
- Dashboard Tab: Where all visuals live (more on this later).
Automating updates
To make your dashboard “live” or near‑real‑time:
- Use schedule refresh through add‑ons.
- Use NOW() or TODAY() formulas to drive dynamic date filters.
- Use QUERY() to pull in data for same‑day last‑week or month‑to‑date comparisons.
The goal: minimum manual effort each week.
Action step
Set up your Google Sheet with:
- RawData tab with your columns.
- Use IMPORTRANGE or add‑on to pull data from at least one channel.
- Confirm you can refresh data and the sheet updates correctly.
Build the Dashboard Layout & Visuals
Now you have data and defined KPIs, let’s make the dashboard itself: clear, visual, intuitive.
Choosing layout
- Reserve one tab (e.g., named “Dashboard”).
- Place summary metrics (cards) at top: total spend, total conversions, CPA, ROAS.
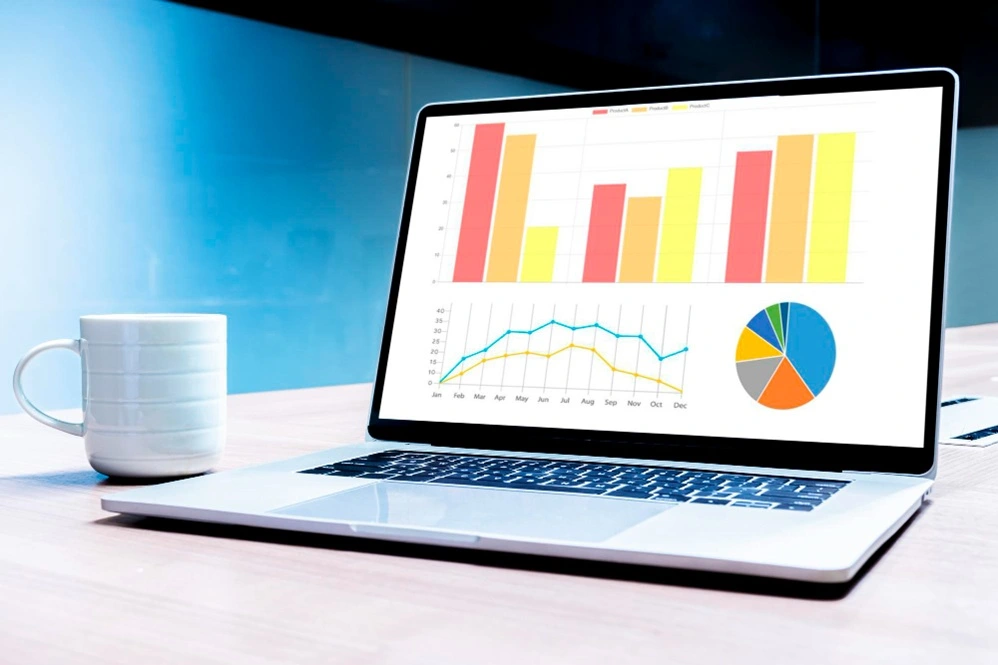
- Below: charts/graphs such as trend line of spend over time, bar chart by channel, pie chart of conversion share, table of top performing campaigns.
- Use colour, spacing, and grouping so it’s easy to scan (especially if you share with stakeholders).
Creating charts & visuals
- Use Sheets → Insert → Chart. Google will suggest chart type.
- Common chart types: line trend for spend over time; bar chart for channel CPA; pie or donut for revenue share.
- Use sparklines for mini‑trends inside tables.
- Use conditional formatting for tables: highlight CPA above target in red, ROAS below target in amber/green.
Interactivity
- Use slicers (Data → Slicer) to filter by channel, date range, region.
- Use drop‑down lists (Data Validation) to select a date range (last 7 days, last 30, custom) and then drive formulas via IF() or QUERY().
Making it India‑friendly
- Use ₹ or USD currency format as needed.
- Use date format like “DD‑MMM‑YYYY” for clarity.
- Use terms familiar in Indian digital marketing: “CPM (₹)”, “CPC (₹)”, “Leads” vs “Conversions”.
Action step
On your Dashboard tab:
- Create at least three visual elements: one summary card, one trend line chart, and one channel‑comparison bar chart.
- Add a slicer or drop‑down to filter by channel or date.
- Apply conditional formatting to one table element (e.g., CPA > target).
Become an AI-powered Digital Marketing Expert
Master AI-Driven Digital Marketing: Learn Core Skills and Tools to Lead the Industry!
Explore CourseAdd Calculations & Formulas
To make the dashboard functional, you need formulas behind the scenes that will compute the KPIs from raw data.
Useful formulas
- SUMIF() / SUMIFS() to calculate total spend or conversions for a given date range or channel.
- QUERY() to aggregate data (e.g., total spend by channel).
- ARRAYFORMULA() to auto‑populate metrics across rows.
- IMPORTRANGE() if pulling data from another Sheet.
- SPARKLINE() for mini trend visuals.
- IFERROR() to handle blanks or missing data gracefully.
Example calculation
Suppose column B = Cost, column C = Clicks, column D = Conversions.
- CPC = =IF(C2>0, B2/C2, “”)
- CPA = =IF(D2>0, B2/D2, “”)
- ROAS (assuming revenue in column E) = =IF(B2>0, E2/B2, “”)
Dynamic date ranges
Use TODAY() and EOMONTH() or DATE() functions to calculate “last 7 days”, “month‑to‑date”, etc. This allows charts to automatically refresh when the date changes.
Action step
In your CleanedData or Metrics tab:
- Create columns for CPC, CPA, and ROAS using formulas.
- Create a dynamic cell showing “Last 7 days spent” using SUMIFS() with date conditions.
- Link these calculations to your Dashboard visuals.
Automate & Share Your Dashboard
A dashboard is most useful when it updates automatically and is easily shareable.
Automation tips
- If using add‑ons like Supermetrics or Coefficient, schedule the data refresh (e.g., every hour or once daily).
- Use a “Refresh” button via Apps Script if you’re comfortable scripting: a simple script that runs SpreadsheetApp.flush() or triggers the import function.
- Keep raw data tab hidden (View → Protected sheets) so viewers focus only on dashboard.
Sharing for multiple stakeholders
- Share the sheet with “View” permissions so others cannot change layout.
- Use Google Sheets → Publish to the web for a client‑friendly sharing link.
- Set notification rules: e.g., when a cell value changes by more than X% trigger email alert.
Maintenance & version control
- Every quarter, review whether KPIs still fit business goals.
- Archive older raw data (e.g., move pre‑2023 data to an Archive sheet) to maintain performance.
- Use Data → Named ranges for key cells so formulas remain clear and maintainable.
Action step
Schedule data refresh for your dashboard (either via add‑on or Apps Script).
Share the dashboard with a stakeholder and get feedback (e.g., “Is the CPA card at top useful?”).
Set one alert: e.g., if CPA > ₹300, send an email to yourself.
Example Use‑Case: Indian Digital Marketing Agency
Let’s bring it all together with a short scenario relevant to India.
Scenario: You run a digital marketing agency in Kochi servicing small e‑commerce clients. You manage three channels: Google Search, Meta Ads (Facebook/Instagram) and Display. You spend the budget in INR and you want to show clients monthly performance, plus your internal team wants weekly snapshots.
Execution:
- RawData tab: daily rows, columns: Date, Channel, Impressions, Clicks, Cost (₹), Conversions (Sales), Revenue (₹).
- Metrics tab: formulas calculating CPC, CPA, ROAS by channel.
- Dashboard tab: top (cards): Total Cost ₹, Total Conversions, Total Revenue ₹, Average CPA, ROAS.
Below:- Trend line of “Cost” vs “Revenue” over last 30 days.
- Bar chart: CPA by channel for last month.
- Pie chart: Revenue share by channel for last month.
- Table: Weekly channel performance with sparklines, conditional formatting for CPA > ₹250 in red.
- Slicer/drop‑down: filter by last 7/14/30 days, channel (All/Google/Search/Meta/Display).
- Automation: Use Supermetrics to pull data from Google Ads & Meta every day at midnight.
- Sharing: Share view‑only link to client; embed in email with “snapshot” link; hidden raw data.
Outcome: Client sees one dashboard, understands where spend is going, which channel is giving best returns and you can proactively optimise (e.g., shift budget from Display to Search if CPA is high).
This kind of dashboard gives you credibility, data‑driven control and scalable reporting without expensive BI tools.
How the Entri App Course Supports This
If you found this walkthrough useful, you might want to deepen your skills further. The Entri App’s AI‑powered Digital Marketing Course is designed for learners like you, digital marketing aspirants, working professionals, and agency owners in India.
Here’s how it aligns with building dashboards:
- It covers analytics modules: how to track, measure and report campaign performance.
- It includes hands‑on practice with Google Sheets, data import, calculation of metrics and visualisation.
- It introduces AI tools and automation (e.g., how to use Google Sheets + add‑ons + scripts) so you can make live dashboards.
- It includes India‑specific examples and teaches how to interpret metrics in local currency, regional channels etc.
- It helps build the background, so you’re not just building the sheet, but understanding what the metrics mean and how to act on them.
If you’re serious about moving from “just running campaigns” to “running data‑driven campaigns”, enrolling in this course can sharpen your edge.
Conclusion
By now, you have a full roadmap to build a performance marketing dashboard in Google Sheets, from defining goals and selecting KPIs, to importing data, building visuals, setting up calculations, automating updates and sharing with stakeholders.
Whether you’re a digital marketing aspirant in Kerala or an agency professional anywhere in India, this skill empowers you to make sense of your campaigns and drive decisions with data rather than gut feel.
If you found this guide helpful, I encourage you to deepen your knowledge with the Entri App’s AI‑powered Digital Marketing Course. It will give you the structured curriculum, hands‑on sessions, and tools to take your analytics game to the next level.
So go ahead: grab a fresh Google Sheet, set up your dashboard, start tracking your metrics, and watch how clarity in data leads to clarity in action.
Happy dashboard‑building and may your metrics always lead you to better campaigns!
Frequently Asked Questions
What is a performance marketing dashboard?
A performance marketing dashboard is a visual tool that shows real-time metrics like ad spend, clicks, conversions, CPA, and ROAS across different marketing channels.
Why should I use Google Sheets for marketing dashboards?
Google Sheets is free, cloud-based, and easy to use. It offers real-time collaboration, easy data imports, charting tools, and automation options, making it ideal for marketers starting out.
Which metrics should I include in a performance marketing dashboard?
Focus on essential KPIs like impressions, clicks, CPC, conversions, CPA, revenue, ROAS, and budget vs actual spend to get actionable insights.
How can I automate data import in Google Sheets?
You can use add-ons like Supermetrics, Coefficient, or built-in functions like IMPORTRANGE, IMPORTDATA, and QUERY to fetch and update data automatically.
Is this method suitable for small businesses and freelancers?
Absolutely! Google Sheets dashboards are perfect for small agencies, freelancers, and solopreneurs who want a low-cost yet powerful way to track marketing performance.
Can I integrate Facebook Ads or LinkedIn Ads with Google Sheets?
Yes, with tools like Supermetrics or manual CSV exports, you can import data from Facebook, LinkedIn, and other platforms into Google Sheets.
How often should I update the dashboard?
Daily or weekly updates are ideal depending on your campaign scale. Use automation to keep your dashboard fresh without manual effort.
What if my campaign spans multiple platforms and currencies?
Standardize your data columns and use formulas to handle currency conversions. Sheets also supports multi-platform aggregation using QUERY or pivot tables.
How can Entri’s course help me with dashboards and analytics?
Entri’s AI-powered Digital Marketing Course teaches you how to track, analyze, and optimize campaigns using Google Sheets and other tools, with hands-on projects and real-world examples tailored to Indian marketers.


