

Table of Contents
Creating a portfolio for data analyst roles is very important today. It shows what you can actually do. A resume lists skills, but not proof. Your portfolio gives life to your skills. It tells your story using real data. You share your process, not just results. Employers love seeing hands-on project examples. This makes your application more powerful and clear. It gives you a real edge over others. Anyone can list tools—few can show impact.
You don’t need to be an expert. Start small and build as you learn. Pick real problems and solve them with data. Use clean visuals to explain your work. Explain your thought process in simple words. Don’t wait to be perfect—just begin now. Share your work on GitHub or LinkedIn. Make sure your projects are easy to follow. The more you share, the more you grow. Let us learn how to build your data analyst portfolio in this blog.
“Ready to take your data science skills to the next level? Sign up for a free demo today!”
How to Build a Portfolio for Data Analyst: Introduction
In data analytics, knowledge alone isn’t enough today. Companies want to see how you apply skills. A strong portfolio reveals your thinking and processing skills. It reflects your ability to handle real data. Not just tools—but how you use them. It shows your problem-solving in practical situations. This adds real value to your job profile.
You’re no longer just another resume on paper. You become someone who gets things done. And that’s exactly what employers look for.
Why a Portfolio Matters in Data Analytics
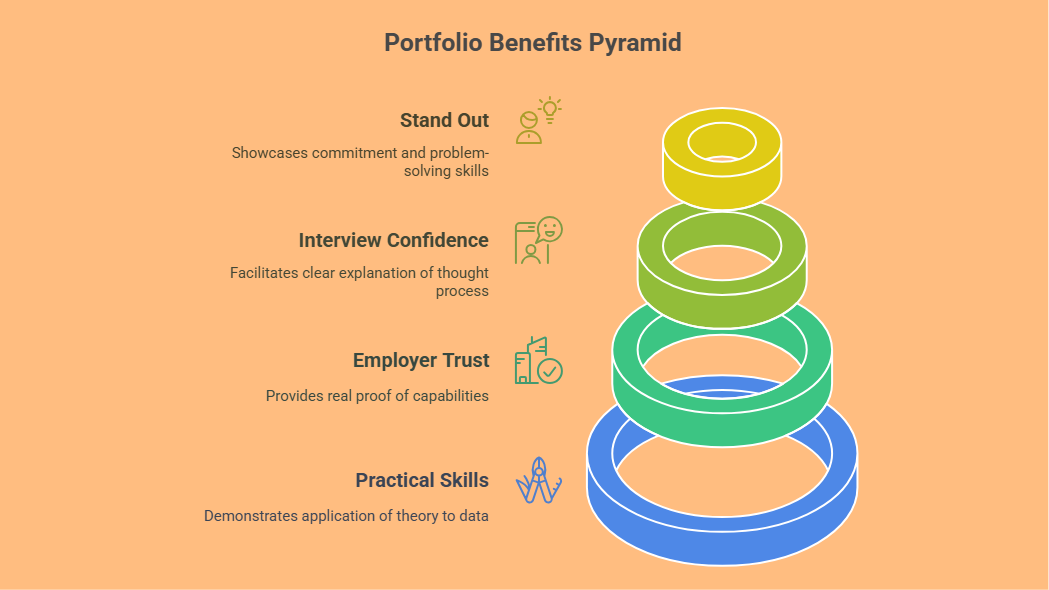
1. Shows Practical Skills
-
Proves you can apply theory to real data.
-
Demonstrates experience with tools like SQL or Python.
-
Highlights data cleaning, analysis, and visualization skills.
2. Builds Trust with Employers
-
Portfolios are real proof of your capabilities.
-
Hiring teams prefer candidates who show work.
-
Shows initiative and effort beyond certifications.
3. Improves Interview Confidence
-
Helps you explain your thought process clearly.
-
Makes it easier to answer technical questions.
-
Gives talking points based on real experience.
4. Helps You Stand Out
-
Many applicants have similar resumes.
-
Few take time to build strong portfolios.
-
Yours shows commitment and problem-solving skills.
Section 1: Why You Need a Data Analytics Portfolio
A resume tells, but a portfolio shows. It brings your data skills to life. You prove your abilities with real examples. Employers want to see your thinking process. They care about how you solve problems. A strong portfolio builds trust and confidence. It also gives you stories to share. That’s powerful during job hunts and interviews.
Key Reasons You Need a Data Analytics Portfolio
1. Shows You Can Do the Work
-
Portfolios prove your skills beyond course certificates.
-
They display hands-on experience with real-world datasets.
-
You demonstrate how you turn data into decisions.
2. Provides Visual Proof of Your Process
-
Employers see how you approach and solve problems.
-
Your steps, tools, and visuals tell a complete story.
-
This is more effective than just listing skills.
3. Boosts Your Confidence in Interviews
-
You’ll have clear examples to discuss in detail.
-
You can explain challenges, insights, and results confidently.
-
This helps you stand out from unprepared candidates.
4. Helps You Build Your Personal Brand
-
Portfolios show you are serious and self-motivated.
-
They reflect your unique style and interests.
-
You become more memorable to recruiters and managers.
Section 2: Key Elements of a Data Analytics Portfolio
A good portfolio is more than project links. It’s your professional story told with structure. Every section should serve a clear purpose. It shows who you are and what you do. Employers should find your work easy to explore.
Each part should highlight your strengths and skills. The layout should feel clean, clear, and complete. Your portfolio must look professional and feel personal.
Essential Sections in a Strong Data Analytics Portfolio
1. About Me
-
Write a short, friendly professional summary.
-
Mention your background, interests, and career goals.
-
Keep it clear, warm, and easy to read.
2. Resume or CV
-
Add a downloadable resume or link to LinkedIn.
-
Include key details like education, tools, and experience.
-
Make sure it’s updated and well-formatted.
3. Projects
-
The most important section of your portfolio.
-
Add 3–5 projects that showcase different skills.
-
For each project, include:
-
Title and brief overview
-
Problem statement
-
Data source and description
-
Methodology and tools used
-
Visuals like charts, dashboards, or screenshots
-
Key outcomes and what you learned
-
4. Skills
-
List your technical skills (e.g., SQL, Excel, Python).
-
Include soft skills like communication or teamwork.
-
Try grouping skills by category or tool type.
5. Certifications & Courses
-
Include relevant online or offline certifications.
-
Mention platforms like Coursera, Entri, or edX.
-
Keep this section neat and easy to scan.
6. Contact Information
-
Make it easy for people to reach you.
-
Add your email, LinkedIn, or a contact form.
-
Check that your links work correctly.
Section 3: Step-by-Step Guide to Building Your Portfolio
A strong portfolio doesn’t happen overnight. You build it one clear step at a time. Choose the right platform to showcase your work. Pick projects that highlight different data skills. Document your process in a simple, readable format. Use visuals that speak more than words can. Always explain what, why, and how you did it. Update it often to stay fresh and relevant.
1. Choose Your Platform
-
Personal Website (e.g., WordPress, Wix, Squarespace)
-
Custom, clean, and professional-looking.
-
Best for full control over design and layout.
-
-
GitHub
-
Perfect for sharing code, notebooks, and documentation.
-
Shows your version control and coding workflow.
-
-
Kaggle
-
Good for competitions, notebooks, and datasets.
-
Highlights your participation in the data community.
-
-
Tableau Public / Power BI
-
Best for interactive dashboards and visuals.
-
Great for non-coding presentation of insights.
-
-
LinkedIn
-
Use the ‘Featured’ section for showcasing projects.
-
Helps recruiters view your work easily.
-
2. Select Projects That Showcase Diverse Skills
-
Data Cleaning & Preprocessing
-
Show how you handled missing or messy data.
-
Include before-and-after transformations.
-
-
Exploratory Data Analysis (EDA)
-
Use graphs and summaries to explore data patterns.
-
Highlight how you discovered useful insights.
-
-
Data Visualization
-
Include charts, dashboards, and storyboards.
-
Focus on clear, user-friendly designs.
-
-
Predictive Modeling
-
Show regression, classification, or clustering work.
-
Explain the problem, model, and results.
-
-
Business Problem Solving
-
Frame projects around real or simulated business needs.
-
Make your insights meaningful and actionable.
-
3. Document Each Project Thoroughly
-
Problem Statement
-
What were you trying to solve?
-
-
Data Source & Description
-
Where the data came from and what it includes.
-
-
Approach & Methodology
-
Explain your step-by-step workflow clearly.
-
-
Tools & Technologies Used
-
Mention tools like Python, SQL, Excel, Tableau, etc.
-
-
Visuals
-
Include relevant charts, dashboards, and screenshots.
-
-
Outcomes & Learnings
-
Summarize results and what you learned from the process.
-
4. Create Clear and Visually Appealing Presentations
-
Keep layouts neat, clean, and easy to follow.
-
Avoid clutter and use white space wisely.
-
Use color thoughtfully to guide attention.
-
Explain technical terms in simple language.
-
Include short summaries or tooltips if needed.
-
Focus on clarity over complexity.
5. Keep Updating Your Portfolio
-
Add new projects as you gain experience.
-
Improve older ones based on feedback.
-
Remove outdated or irrelevant work.
-
Track your growth by updating regularly.
-
This shows continuous learning and active engagement.
“Ready to take your data science skills to the next level? Sign up for a free demo today!”
Section 4: Tools & Platforms to Showcase Your Work
Choosing the right platform makes a big difference. It affects how others view your work. Some platforms are great for visuals and dashboards. Others are best for code and notebooks. Pick one or two that match your style. Use them to show different parts of your skills. What matters most is clarity and easy access. Make sure your portfolio is organized and updated.
Top Tools & Platforms to Showcase Your Portfolio
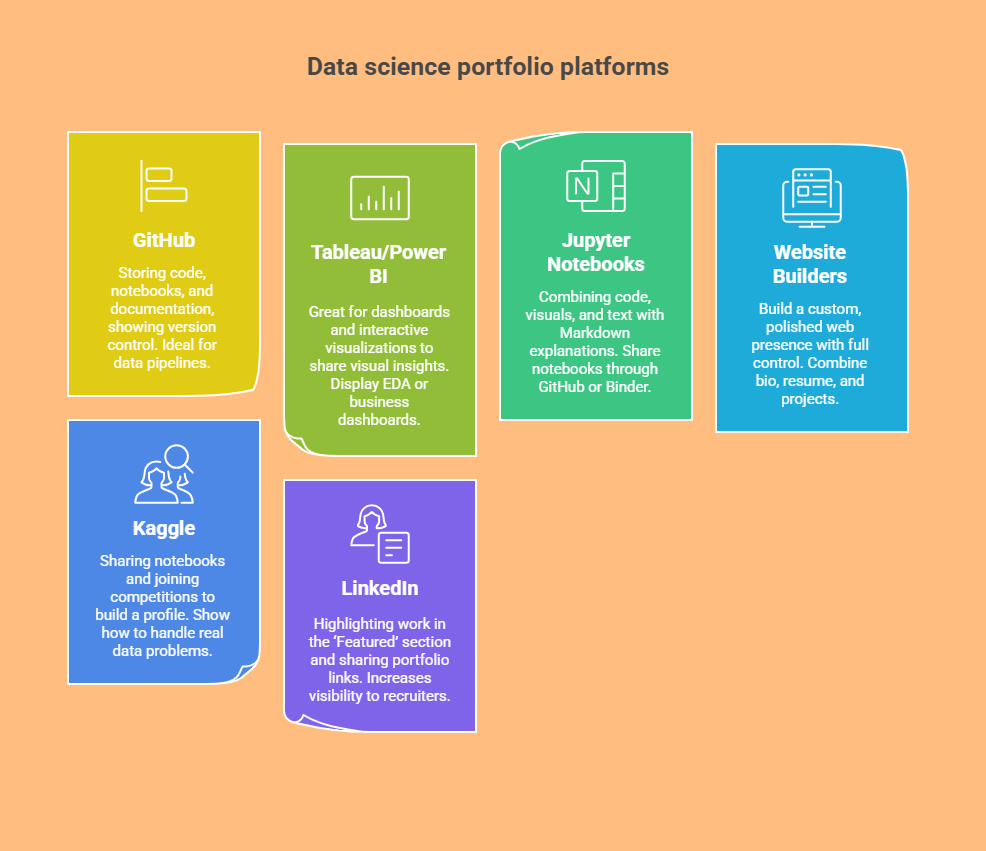
1. GitHub
-
Best for storing code, Jupyter notebooks, and documentation.
-
Shows version control and good coding practices.
-
Ideal for Python, R, SQL, and data pipelines.
2. Tableau Public / Power BI
-
Great for dashboards and interactive visualizations.
-
Lets you share visual insights without code.
-
Use it to display EDA or business dashboards.
3. Jupyter Notebooks
-
Perfect for combining code, visuals, and text.
-
Use Markdown to explain your steps clearly.
-
Share notebooks through GitHub or Binder links.
4. Personal Website Builders (Wix, WordPress, Squarespace)
-
Helps you build a custom, polished web presence.
-
Allows full control over layout, design, and sections.
-
Great for combining bio, resume, and projects.
5. Kaggle
-
Ideal for sharing notebooks and joining competitions.
-
Lets you build a profile in the data community.
-
Show how you handle real data problems.
6. LinkedIn
-
Use the ‘Featured’ section to highlight your work.
-
Share portfolio links or visuals as posts.
-
Increases your visibility to recruiters and connections.
Section 5: Sample Projects to Include
Your project choices shape your portfolio’s impact. Aim to cover different tools and skills. Each project should solve a real-world problem. Choose topics that interest you or show business value. Don’t worry about big datasets—clarity matters more. Focus on insights, structure, and clean presentation. Explain your thought process behind every decision made. Strong projects make recruiters stop and pay attention.
Sample Projects for a Data Analyst Portfolio
1. Sales Data Analysis & Forecasting
-
Clean raw sales data and handle missing values.
-
Use time-series or trend analysis for forecasting.
-
Show monthly patterns, seasonal trends, or business insights.
-
Include dashboards showing KPIs and forecasts.
2. Customer Segmentation Using Clustering
-
Work with marketing or e-commerce datasets.
-
Use K-means or hierarchical clustering to group customers.
-
Visualize clusters using 2D plots or heatmaps.
-
Explain how segmentation helps in targeting or offers.
3. Social Media Sentiment Analysis
-
Collect tweets or reviews using public APIs.
-
Use NLP techniques to classify sentiment.
-
Visualize positive vs. negative trends over time.
-
Link insights to brand reputation or user feedback.
4. A/B Testing Results & Insights
-
Create a test-control group scenario.
-
Analyze conversion rates or click-through data.
-
Use statistical tests to validate findings.
-
Show results with simple, readable visuals.
5. Predictive Modeling for Churn Rate
-
Use classification models like Logistic Regression or XGBoost.
-
Predict which customers are likely to leave.
-
Explain model accuracy, precision, and recall.
-
Suggest actions based on the analysis.
6. Public Dataset Analysis (e.g., COVID-19, Stock Market)
-
Choose an open dataset from sources like Kaggle or government sites.
-
Explore trends, patterns, or policy impacts.
-
Visualize key findings using charts or dashboards.
-
Add commentary or business implications.
Each of these projects should include:
-
A clear title and goal
-
The tools and methods used
-
Visuals or dashboards where relevant
-
A short summary of outcomes and learnings
Section 6: Tips for Making Your Portfolio Stand Out
Many portfolios look the same at first glance. What makes yours stand out is the details. It’s not just about having good projects. It’s how you present your thinking clearly. Every insight must connect to real-world value. Your style, tone, and clarity show professionalism. Let your curiosity and effort shine through. That’s what impresses recruiters the most.
Smart Tips to Make Your Data Analyst Portfolio Shine
1. Showcase Problem-Solving Skills
-
Don’t just show results—explain how you got them.
-
Walk through your thought process in each project.
-
Include challenges faced and how you solved them.
2. Use Real or Realistic Datasets
-
Real data adds authenticity and complexity.
-
Use public datasets (e.g., Kaggle, government portals).
-
If made-up, make it look professional and structured.
3. Highlight Business Context and Impact
-
Don’t just say what you did—say why it matters.
-
Add context: “This analysis helped reduce churn.”
-
Link insights to real business goals or benefits.
4. Clarify Your Role in Team Projects
-
If you worked with others, state your part clearly.
-
Mention if you led, cleaned data, or built models.
-
This helps recruiters understand your specific contributions.
5. Link to GitHub, Dashboards, and Code
-
Include clickable links for easy access.
-
Label each link clearly: “Dashboard,” “Code,” “Report.”
-
Test links to make sure everything works.
6. Add Testimonials or Recommendations (if possible)
-
Share quotes from mentors, managers, or team members.
-
Even peer feedback shows collaboration and professionalism.
-
Keep it short and relevant to your projects.
7. Keep it Visually Clean and Easy to Navigate
-
Use clear fonts, sections, and white space.
-
Avoid clutter and overly complex visuals.
-
A neat design makes a lasting impression.
“Ready to take your data science skills to the next level? Sign up for a free demo today!”
Section 7: How to Present Your Portfolio in Job Applications & Interviews
Creating a portfolio is only the first step. Next, you must present it the right way. Don’t wait for recruiters to ask about it. Put your portfolio in front of their eyes. Let it guide your resume and interview answers. Mention projects that match the job role. Show that you’re more than just a resume. Let your work speak with confidence and clarity.
How to Use Your Data Analytics Portfolio During Job Search
1. Add the Portfolio Link to Your Resume
-
Place it at the top near your contact info.
-
Use a short, clean link (custom URLs help).
-
Example:
yourname.github.iooryournameportfolio.com
2. Include It in Your LinkedIn Profile
-
Add it to the ‘Featured’ section on your profile.
-
Mention specific projects in posts or job descriptions.
-
Share new projects as updates to show activity.
3. Reference Projects During Interviews
-
Match your past work to the job’s requirements.
-
Say: “I did a similar analysis on churn.”
-
Use stories from your portfolio to explain your skills.
4. Be Ready to Walk Through Your Process
-
Practice explaining your projects step-by-step.
-
Use simple terms to explain technical parts.
-
Talk about tools, choices, results, and takeaways.
5. Tailor Which Projects You Highlight
-
Choose projects relevant to the company or industry.
-
For a marketing role, highlight customer segmentation.
-
For finance, show forecasting or trend analysis.
6. Show Enthusiasm and Curiosity
-
Speak with interest about what you learned.
-
Mention improvements you’d make next time.
-
This shows growth mindset and passion.
How to Build a Portfolio for Data Analyst: Conclusion
A strong data analytics portfolio builds real impact. It shows skills that resumes alone can’t prove. Recruiters want to see how you think. Projects reveal your problem-solving and technical strengths. Each project tells a part of your journey. Update your portfolio as you grow and learn. Use clear visuals and simple explanations always. Choose platforms that suit your work style best. Let your passion for data clearly shine through. Start building or refining your portfolio today!
| Related Links | |
| Data Analyst Career Path | Data Analyst Roadmap for Beginners: Step-by-Step Guide |
| Top Companies Hiring Data Analysts in Kerala | How to Start a Career in Data Analytics in Kerala? |
Frequently Asked Questions
How do I build a data analytics portfolio?
Start by choosing a platform like GitHub, Tableau Public, or a personal website. Select 3–5 diverse projects that showcase different skills like data cleaning, visualization, and modeling. Document each project clearly with problem statements, tools used, visuals, and outcomes. Focus on quality over quantity and update your work regularly.
How does a data analyst portfolio look like?
A data analyst portfolio is usually structured like a personal website or GitHub repository. It includes an ‘About Me’ section, resume, project summaries, skills, certifications, and contact information. Each project typically contains code, visuals, and short write-ups. Clean layout, easy navigation, and clear explanations are key.
What is a portfolio in data analytics?
A data analytics portfolio is a curated collection of your practical work. It highlights your ability to solve real-world data problems using tools like Python, SQL, Tableau, etc. Think of it as proof of your skills beyond your resume. It helps employers evaluate your hands-on experience.
How long does it take to make a data analyst portfolio?
If you already have a few projects, you can build a basic portfolio in 1–2 weeks. If you’re starting from scratch, expect 1–2 months to learn tools, complete projects, and organize everything. Quality documentation and design take time, so don’t rush. Focus on clarity and impact.
Do data analysts need a portfolio?
Yes, especially if you’re starting out or switching careers. A portfolio helps demonstrate your skills with real work samples. It gives you an edge over others with just theoretical knowledge. Employers value what you can do, not just what you know.
How do I start a data analyst career from scratch?
Begin by learning core skills like Excel, SQL, Python, and data visualization tools. Take online courses and practice with public datasets. Complete small projects and gradually build a portfolio. Network on LinkedIn and apply for internships or entry-level roles.
How do I create a data entry portfolio?
A data entry portfolio should showcase your accuracy, speed, and attention to detail. Include small projects like survey data input, Excel cleaning tasks, or transcription work. Document your process and tools used. Highlight consistency, formatting skills, and error-checking techniques.
How do you monetize data analytics?
You can monetize your skills through freelancing, consulting, or full-time roles. Some analysts also create courses, write blogs, or build niche dashboards for clients. Platforms like Upwork, Fiverr, and LinkedIn help you find paid projects. As your skills grow, so do your income opportunities.
How to create a portfolio for IT projects?
Structure it by project type: software development, database work, automation, etc. Include descriptions, tools used, your role, screenshots, and source code links. Use GitHub or a personal website for hosting. Make sure to include your resume, certifications, and contact info.
Which two programming languages are most useful for data analysis?
Python and SQL are the most widely used. Python is great for analysis, automation, and visualization. SQL helps in querying and managing structured data. Knowing both gives you a strong foundation for most data roles.


