
Table of Contents
Data Analytics Trends are shaping business decisions in 2026. Companies depend more on data than assumptions. Every industry now uses data for daily planning. Data Analytics Trends help businesses grow with confidence. Leaders want clear insights to act faster. Data driven thinking is now essential everywhere.
Technology around data is changing very fast. Analytics tools are becoming easier to use. Teams want quick answers without technical effort. Automation supports everyday data analysis tasks. Real time insights improve faster business responses. Ethics and data responsibility matter more now. Learning these trends helps future careers grow.
Join Our Online Data Analytics Course!
Introduction: Data-driven decision making in 2026
Data-driven decision making is essential in 2026. Businesses no longer rely on guesswork. Every decision starts with trusted data. Leaders want proof before taking action. Data helps reduce mistakes and risks. Speed and clarity are now very important. Markets change faster than ever before. Data analytics helps businesses respond quickly. It supports planning, growth, and daily operations. This approach is common across all industries.
Technology has made data easier to use. Cloud systems allow access from anywhere. Modern tools analyze data within seconds. Automation reduces manual work for teams. AI helps find useful patterns in data. Real time data shows what is happening now. Businesses can act without long delays. Quick decisions prevent missed opportunities. Data driven culture improves teamwork and trust. Results can be clearly measured and reviewed.
Good decisions depend on data quality. Accurate data builds confidence in insights. Poor data leads to wrong conclusions. Data governance ensures consistency and safety. Ethical data use is increasingly important. Privacy rules affect how data is handled. Responsible analytics protects users and organizations. Trust encourages wider use of data insights. Simple insights are easier to explain. Clarity matters more than complexity.
Why data driven decisions matter in 2026:
- Faster response to market changes
- Better accuracy in planning and forecasting
- Stronger coordination between business teams
- Lower operational and financial risks
- Improved competitive position
How businesses use data for decisions:
- Dashboards for daily performance tracking
- Predictive analytics for future planning
- Real time analytics for operations
- Self service analytics for teams
- Insights integrated into business workflows
In 2026, data shapes every major decision. Businesses ignoring data struggle to compete. Smart data use drives long term success.
Major Trends in Data Analytics for 2026
Data analytics continues to grow in importance. Businesses rely on data for almost every decision. Competition makes data usage more critical. Markets change faster than ever before. Decisions must be accurate and timely. Analytics supports speed and confidence. Technology is simplifying complex data tasks. Analytics is no longer limited to specialists. Non technical teams also use data daily. These trends define analytics in 2026.
Organizations invest heavily in analytics platforms. Data helps reduce uncertainty and risks. Insights guide strategy and daily operations. Analytics connects planning with execution. It supports growth and efficiency goals. Modern analytics focuses on usability and trust. Automation plays a major role now. AI supports insight discovery at scale. Governance ensures responsible data usage. Together, these trends shape future analytics.
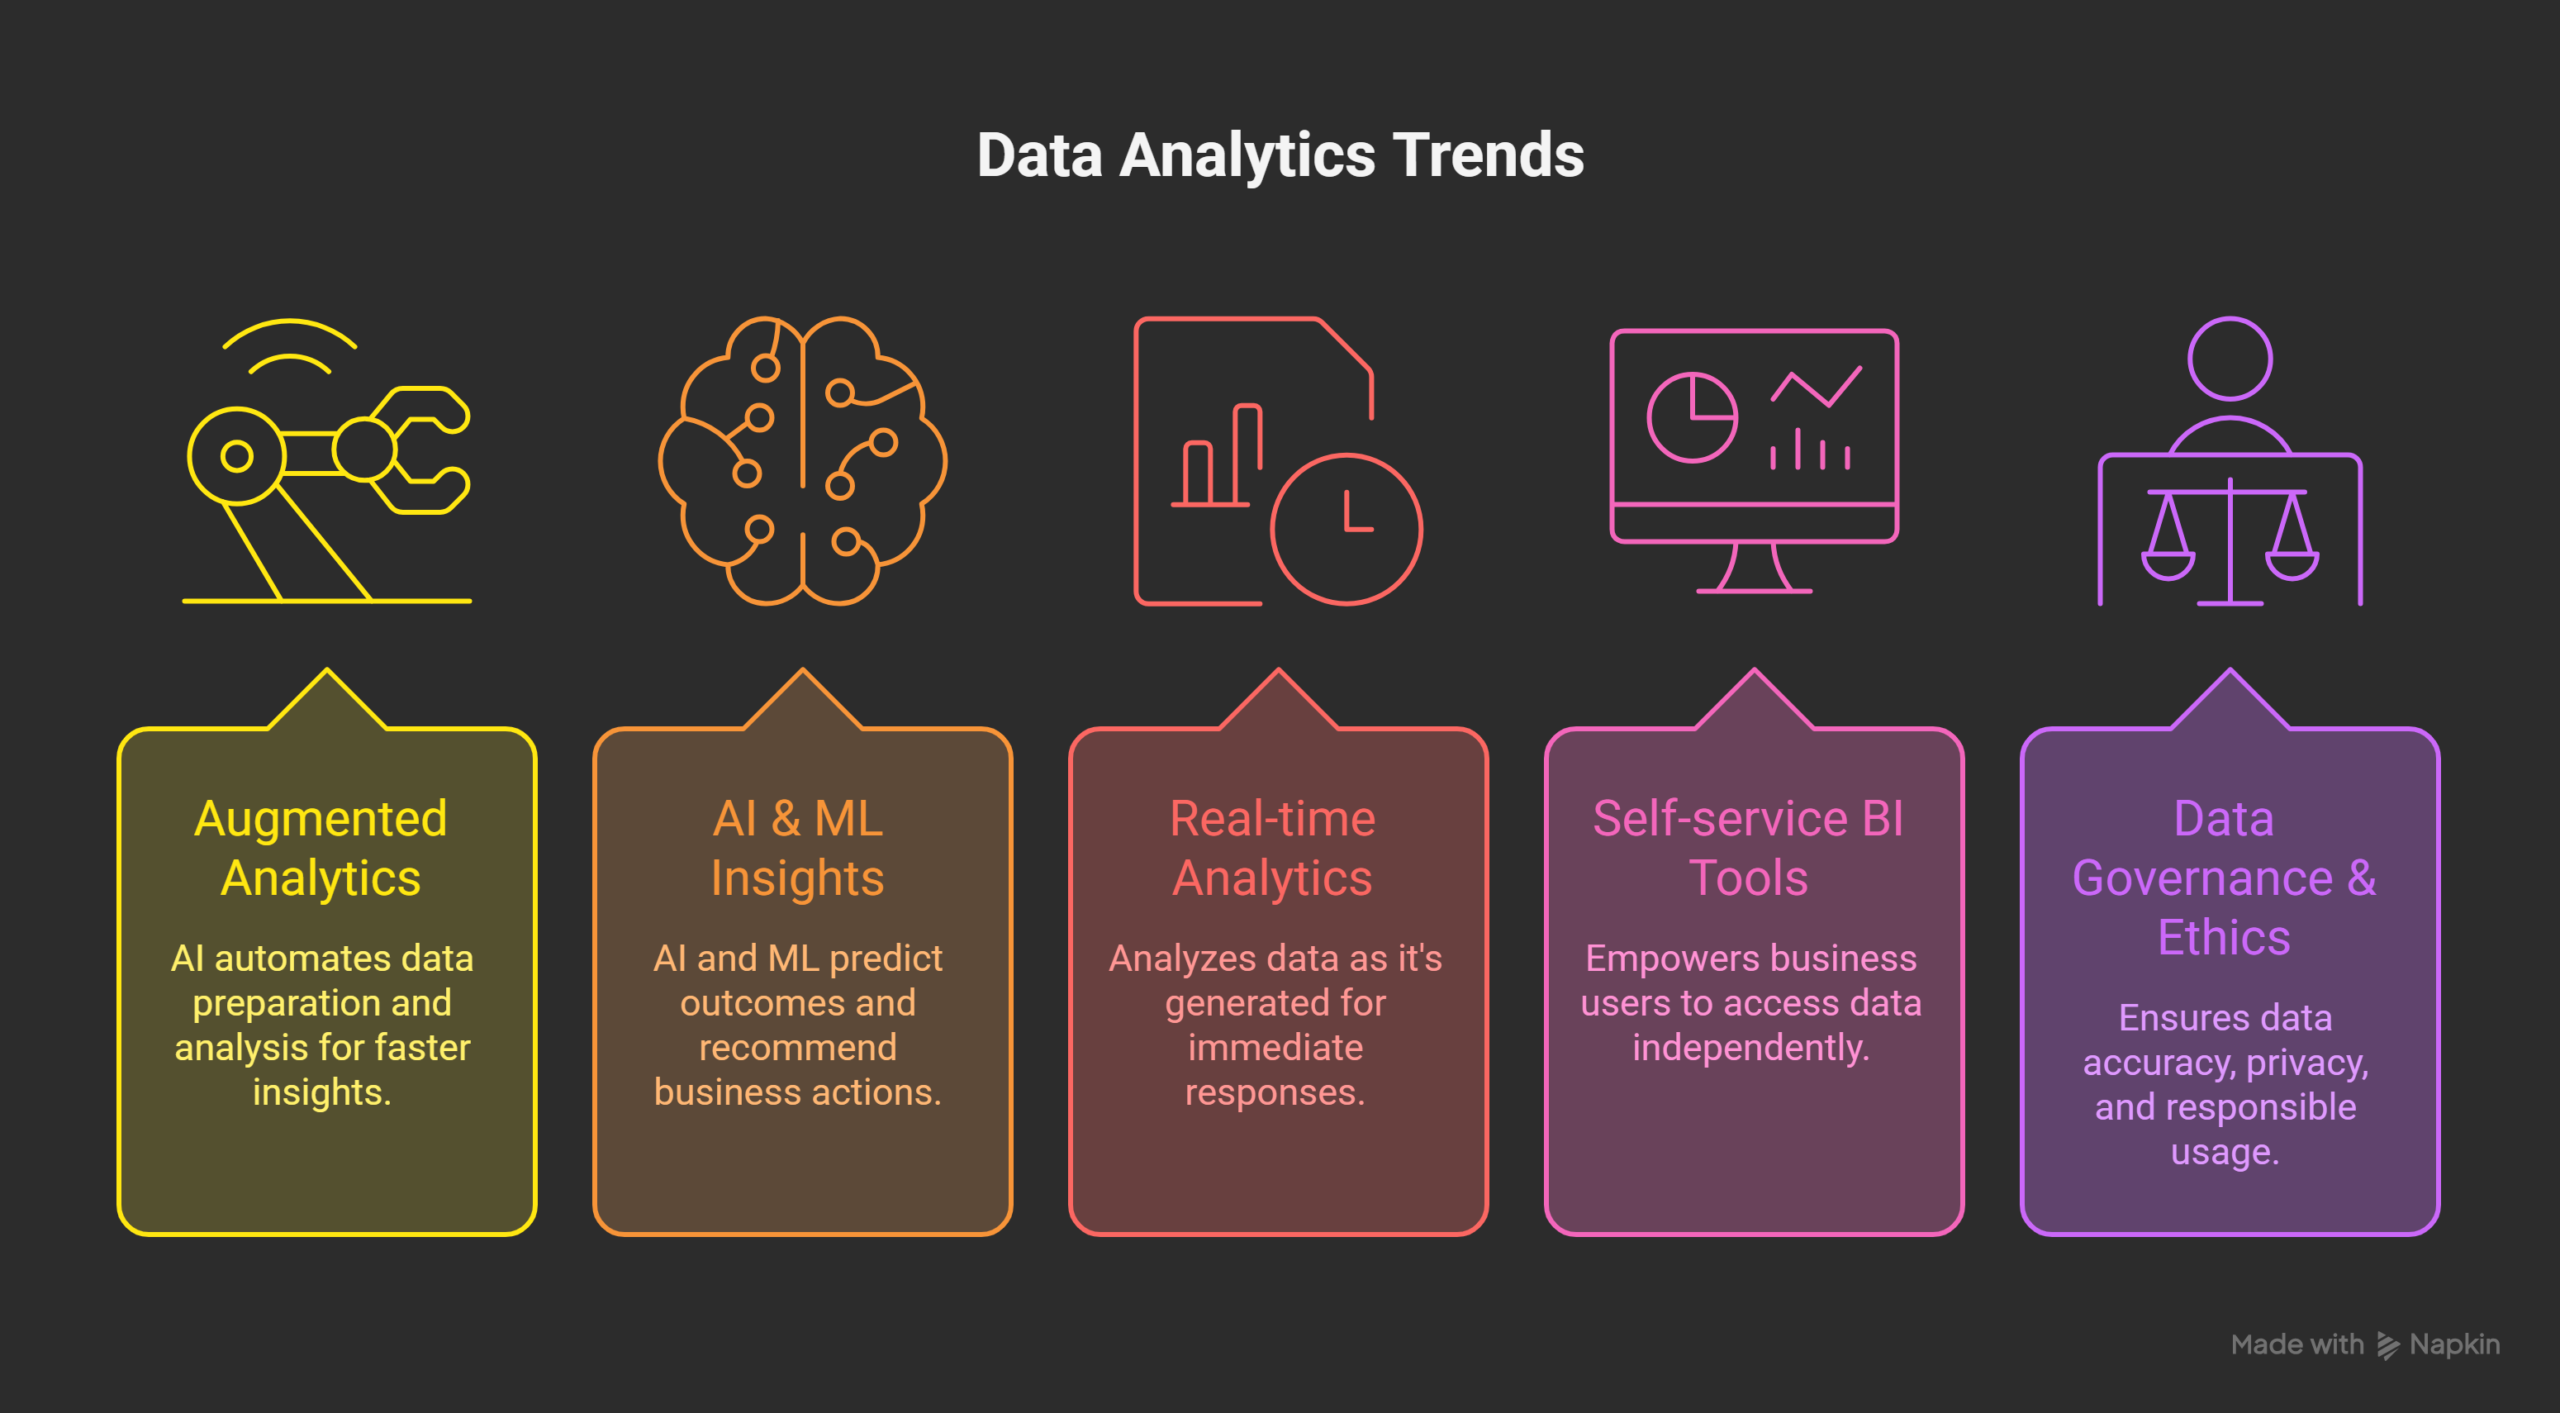
Augmented Analytics
Meaning of augmented analytics
Augmented analytics uses artificial intelligence for analysis. It assists users during data exploration. The system suggests insights automatically. Manual analysis effort is reduced significantly. Users receive explanations instead of raw numbers. Complex analysis becomes easier to understand. Automation replaces repetitive analytical tasks. Users focus more on decision making.
Augmented analytics supports both beginners and experts. Business users gain confidence using data. Analytics becomes more approachable for everyone. The system guides users step by step. Errors are reduced through automation. Time required for insights decreases.
Why augmented analytics is important
Traditional analytics requires strong technical skills. Many users struggle with advanced tools. This limits data usage across teams. Augmented analytics removes these barriers. Users can ask questions in plain language. Insights are generated automatically. This speeds up business decisions. Teams no longer wait for analysts.
Faster insights improve competitive advantage. Decisions are supported by data evidence. Analytics adoption increases across departments. Confidence in insights improves significantly. Business value from data increases.
Key features of augmented analytics
Automation features
- Automatic data preparation
- Automatic data cleaning
- Automated insight detection
- Automated trend identification
User experience features
- Natural language questions
- Natural language explanations
- Smart visual recommendations
- Suggested follow up questions
Decision support features
- Recommended actions
- Predictive outcome suggestions
- Anomaly alerts
- Performance summaries
Benefits for organizations
- Reduced dependency on analysts
- Faster insight generation
- Improved decision consistency
- Better data adoption
- Higher productivity across teams
Managers gain faster performance visibility. Executives receive summarized insights quickly. Teams collaborate using shared dashboards. Analytics becomes part of daily work.
Business use cases
Sales teams track performance trends automatically. Marketing teams evaluate campaign effectiveness quickly. Finance teams monitor expenses and risks. Operations teams identify process bottlenecks early. Human resources teams analyze workforce data easily.
AI & ML-Driven Insights
Role of AI and machine learning
Artificial intelligence analyzes massive datasets efficiently. Machine learning models learn from historical data. Patterns are identified faster than humans. Insights improve with continuous learning. Analytics becomes predictive and proactive.
AI processes structured and unstructured data. Models analyze text, images, and numbers. Insights go beyond basic reporting. Decision making becomes more advanced.
Types of AI-driven insights
Predictive insights
- Forecast future demand
- Predict customer behavior
- Estimate revenue trends
- Anticipate operational risks
Prescriptive insights
- Recommend optimal actions
- Suggest pricing strategies
- Propose inventory adjustments
- Guide marketing decisions
Detection insights
- Identify anomalies
- Detect fraud patterns
- Highlight unusual behavior
- Monitor system irregularities
Discovery insights
- Find hidden relationships
- Reveal customer segments
- Uncover operational inefficiencies
- Identify growth opportunities
Business value of AI insights
Organizations plan better using predictions. Customer experiences improve through personalization. Risks are identified earlier. Costs are controlled more effectively. Operations become more efficient.
Leaders make informed strategic decisions. AI reduces human bias in analysis. Scalability improves across analytics systems. Insights remain consistent across departments.
Challenges in AI analytics
- Models can lack transparency
- Bias may exist in data
- Poor data reduces accuracy
- Models require regular updates
Understanding AI outputs can be difficult. Trust issues slow adoption. Ethical concerns continue to grow. Skilled professionals remain limited.
Best practices for AI analytics
- Use diverse and clean data
- Validate models frequently
- Monitor outcomes continuously
- Document model behavior clearly
- Combine AI with human judgment
Real-Time Analytics
Meaning of real-time analytics
Real-time analytics processes data immediately. Insights appear as events occur. There is little or no delay.
Decisions happen instantly.
Data flows continuously into systems. Analytics reacts to live data streams. Businesses act while events happen.
Importance of real-time analytics
Customer expectations change rapidly. Delays cause lost opportunities. Problems grow without quick responses. Real-time insights enable faster reactions.
Competitive advantage depends on speed. Businesses must act before competitors. Immediate insights reduce potential losses.
Common real-time analytics use cases
Customer focused use cases
- Personalized product recommendations
- Real-time customer support
- Dynamic website content
- Live behavior tracking
Operational use cases
- System performance monitoring
- Supply chain visibility
- Inventory tracking
- Workforce monitoring
Risk management use cases
- Fraud detection
- Security threat monitoring
- Compliance alerts
- Financial transaction monitoring
Technologies enabling real-time analytics
- Streaming data platforms
- Event driven systems
- In memory databases
- Low latency analytics engines
These technologies process data quickly. They support continuous analysis. Scalability is a key requirement.
Benefits of real-time analytics
- Faster operational decisions
- Improved customer satisfaction
- Reduced financial losses
- Continuous business visibility
Challenges of real-time analytics
- Infrastructure costs are high
- Systems require constant monitoring
- Data accuracy is critical
- Skilled engineers are required
Join Our Online Data Analytics Course!
Self-Service BI Tools
Meaning of self-service BI
Self-service BI (Business Intelligence) allows independent data exploration. Users analyze data without analysts. Dashboards are easily accessible. Reports are generated quickly.
Business users control their insights. Decision making becomes decentralized. Analytics becomes more democratic.
Evolution of self-service BI
Early BI tools were complex. They required technical expertise. Modern tools focus on simplicity. User experience is prioritized.
AI improves search and insights. Natural language queries are supported. Visualization creation becomes easier.
Key features of self-service BI
Data access features
- Centralized data sources
- Governed data models
- Secure user access
Analysis features
- Drag and drop visuals
- Prebuilt dashboards
- Interactive filters
Sharing features
- Easy report sharing
- Collaboration tools
- Export options
Advantages of self-service BI
- Faster decisions across teams
- Reduced analytics team workload
- Improved data literacy
- Better business agility
Teams answer questions immediately. Dependency on IT decreases. Innovation increases across departments.
Risks of unmanaged self-service BI
- Conflicting metrics
- Inconsistent reports
- Data misinterpretation
- Loss of trust
Best practices for self-service BI
- Maintain standardized metrics
- Provide user training
- Monitor dashboard usage
- Enforce governance controls
Data Governance & Ethics
Importance of data governance
Data governance ensures data reliability. It defines ownership and accountability. Consistency improves trust. Analytics accuracy depends on governance.
Organizations manage data as assets. Clear rules guide data usage. Governance supports compliance requirements.
Core components of data governance
Data quality management
- Accuracy standards
- Completeness checks
- Consistency rules
Security and access control
- Role based access
- Data encryption
- Audit trails
Documentation and lineage
- Data definitions
- Source tracking
- Transformation records
Growing importance of data ethics
Ethical data use builds trust. Customers demand transparency. AI increases ethical responsibilities. Organizations must act responsibly.
Ethical challenges in analytics
- Bias in algorithms
- Discriminatory decisions
- Excessive data collection
- Lack of informed consent
Regulatory influence on analytics
Privacy laws shape data practices. Compliance requirements continue increasing. Penalties for violations are severe. Governance teams become strategic.
Best practices for ethical analytics
- Review data sources regularly
- Monitor models for bias
- Limit data access responsibly
- Communicate data usage clearly
Comparison of Major Analytics Trends
| Trend | Main Purpose | Key Benefit | Key Challenge |
|---|---|---|---|
| Augmented analytics | Automated insights | Faster understanding | User trust |
| AI & ML insights | Predictive intelligence | Better decisions | Bias risks |
| Real-time analytics | Immediate actions | Speed advantage | High costs |
| Self-service BI | User independence | Wider adoption | Metric conflicts |
| Data governance | Trust and control | Reliable data | Complexity |
How These Trends Work Together
Analytics trends do not work alone. They support each other. AI powers augmented analytics. Real-time systems feed AI models. Self-service tools use governed data. Governance ensures trust everywhere.
Organizations must align people and technology. Clear strategy guides analytics adoption. Training improves long term success.
In Short
Data analytics in 2026 is accessible. Insights are faster and clearer. AI enhances decision making. Real-time analytics supports quick action. Self-service tools empower teams. Governance ensures trust and responsibility.
Organizations embracing these trends succeed. Others risk falling behind. Simple and ethical analytics wins. The future belongs to data driven organizations.
Tools & Technologies to Learn for Data Analytics
Learning the right tools is essential in 2026. Tools help turn data into useful insights. Technology simplifies analysis and decision making. Each tool serves a specific purpose. A balanced skill set is very important. Both technical and business tools matter.
Data Fundamentals Tools
SQL for data querying
SQL is the foundation of data analytics. It helps retrieve data from databases. Most analytics roles require SQL knowledge. Queries help filter, join, and summarize data.
Why SQL is important
- Works with almost all databases
- Easy to learn and powerful
- Required for analytics interviews
Key SQL skills to learn
- Basic select queries
- Filtering using where clauses
- Grouping and aggregation
- Joins across multiple tables
Programming Languages for Analytics
Python for data analysis
Python is widely used in analytics. It supports data cleaning and analysis. Python handles large datasets efficiently.
Common Python uses
- Data cleaning and preparation
- Statistical analysis
- Automation of repetitive tasks
Important Python libraries
- Pandas for data handling
- NumPy for calculations
- Matplotlib for basic visualizations
R for statistical analysis
R is strong in statistics and research. It is useful for deep data analysis. Many researchers prefer R.
Data Visualization & BI Tools
Business Intelligence tools
BI tools help visualize data clearly. They convert numbers into charts. Dashboards help monitor performance.
Popular BI tools
- Power BI
- Tableau
- Looker
Key BI skills
- Dashboard creation
- Chart selection
- KPI tracking
- Report sharing
Benefits of BI tools
- Easy data understanding
- Faster decision making
- Improved communication
Cloud Data Platforms
Data warehouses
Cloud platforms store large data volumes. They allow fast data access. They scale easily with business growth.
Popular cloud platforms
- Snowflake
- Google BigQuery
- Amazon Redshift
Why cloud platforms matter
- Handle large datasets
- Support remote access
- Reduce infrastructure maintenance
Big Data & Lakehouse Technologies
Data lakes and lakehouse systems
Data lakes store raw data. Lakehouses combine lakes and warehouses. They support advanced analytics.
Key technologies to learn
- Databricks
- Delta Lake
- Apache Spark
Use cases
- Large scale data processing
- Machine learning workflows
- Historical data storage
Real-Time & Streaming Tools
Streaming data platforms
Streaming tools process live data. They support real-time analytics.
Popular streaming tools
- Apache Kafka
- Apache Flink
Common use cases
- Fraud detection
- Live dashboards
- System monitoring
AI & Machine Learning Tools
Machine learning frameworks
ML tools build predictive models. They help forecast future outcomes.
Key ML tools
- Scikit-learn
- TensorFlow
- PyTorch
Important ML skills
- Model training basics
- Feature selection
- Model evaluation
Data Governance & Quality Tools
Governance and quality management
Governance tools ensure data trust. They control access and usage.
Key governance tools
- Data catalogs
- Lineage tracking tools
- Access control systems
Why governance tools matter
- Improve data reliability
- Support compliance requirements
- Build trust in analytics
Tool Category Comparison Table
| Category | Purpose | Example Tools |
|---|---|---|
| SQL | Data querying | MySQL, PostgreSQL |
| Programming | Data analysis | Python, R |
| BI tools | Visualization | Power BI, Tableau |
| Cloud platforms | Data storage | Snowflake, BigQuery |
| Big data | Large processing | Spark, Databricks |
| Streaming | Real-time data | Kafka, Flink |
| ML tools | Predictions | Scikit-learn |
| Governance | Data trust | Data catalogs |
Learning Strategy for Tools
Start with SQL and BI tools. Then learn Python for analysis. Move to cloud data platforms next. Explore big data tools gradually. Add real-time tools if required. Learn ML basics for advanced roles. Understand governance principles early.
In Short
Tools shape analytics capabilities. Learning tools improves career opportunities. Focus on fundamentals first. Practice using real datasets. Balance tools with business understanding. Continuous learning is essential in analytics.
Join Our Online Data Analytics Course!
Career Roles & Demand in Data Analytics
Data analytics careers continue growing in 2026. Organizations need data skilled professionals everywhere. Demand spans technical and business focused roles. Roles vary by skill level and specialization. Career paths are flexible and evolving. Analytics skills open opportunities across industries.
Data Analyst
Role overview
Data analysts interpret data for business decisions. They focus on reporting and descriptive analysis. Dashboards and reports are key responsibilities. They answer business performance questions.
Key responsibilities
- Clean and prepare datasets
- Create dashboards and reports
- Analyze trends and patterns
- Communicate insights clearly
Skills required
- Strong SQL knowledge
- BI tools expertise
- Basic statistical understanding
- Business communication skills
Demand outlook
Demand remains strong across industries. Entry level roles are widely available. Business teams rely heavily on analysts.
Business Intelligence Analyst
Role overview
BI analysts focus on performance monitoring. They design dashboards for leadership teams. Metrics and KPIs are their core focus.
Key responsibilities
- Define business metrics
- Build standardized dashboards
- Maintain reporting consistency
- Support decision makers
Skills required
- BI tools mastery
- Data modeling basics
- KPI design knowledge
- Stakeholder communication
Demand outlook
Organizations prioritize consistent reporting. BI analysts ensure data trust. Demand is steady and growing.
Data Engineer
Role overview
Data engineers build analytics infrastructure. They manage data pipelines and systems. Reliable data flow is their responsibility.
Key responsibilities
- Build data pipelines
- Manage data warehouses
- Ensure data quality
- Optimize data performance
Skills required
- SQL and Python
- Cloud platforms knowledge
- ETL tools experience
- Big data frameworks
Demand outlook
Data engineers are highly demanded. Modern analytics depends on them. Salaries are among the highest.
Analytics Engineer
Role overview
Analytics engineers bridge engineering and analysis. They transform data for business use. Metric layers are their focus.
Key responsibilities
- Build analytics models
- Define trusted metrics
- Support BI tools
- Improve data reliability
Skills required
- SQL expertise
- Data modeling knowledge
- Analytics engineering tools
- Collaboration skills
Demand outlook
This role is growing rapidly. Companies need trusted analytics layers. Demand continues increasing.
Data Scientist
Role overview
Data scientists build advanced analytical models. They focus on predictions and experimentation. Statistics and machine learning are central.
Key responsibilities
- Build predictive models
- Analyze complex datasets
- Test hypotheses
- Communicate findings
Skills required
- Python or R
- Statistics knowledge
- Machine learning basics
- Problem solving skills
Demand outlook
Demand remains strong but specialized. Roles require advanced skills. Experience increases employability.
Machine Learning Engineer
Role overview
ML engineers deploy models into production. They focus on scalability and performance. Models must run reliably.
Key responsibilities
- Deploy ML models
- Monitor model performance
- Optimize inference systems
- Maintain pipelines
Skills required
- Python programming
- ML frameworks knowledge
- Cloud deployment skills
- MLOps understanding
Demand outlook
Demand grows with AI adoption. Roles are highly technical. Salaries are competitive.
Data Governance & Quality Specialist
Role overview
Governance specialists ensure data trust. They manage policies and standards. Compliance is a key responsibility.
Key responsibilities
- Define data standards
- Manage access controls
- Monitor data quality
- Support compliance audits
Skills required
- Data governance concepts
- Regulatory knowledge
- Documentation skills
- Stakeholder coordination
Demand outlook
Governance roles are increasing. Regulations drive demand. Organizations value trusted data.
Analytics Translator / Product Analyst
Role overview
These roles connect business and analytics. They translate questions into data tasks. Communication is their strength.
Key responsibilities
- Gather business requirements
- Define analytics goals
- Interpret analytical outputs
- Guide decision making
Skills required
- Business understanding
- Analytics basics
- Communication skills
- Problem framing ability
Demand outlook
Demand increases with analytics adoption. Businesses need clear interpretation. This role improves analytics impact.
Career Demand Comparison Table
| Role | Main Focus | Demand Level |
|---|---|---|
| Data Analyst | Reporting and insights | High |
| BI Analyst | Metrics and dashboards | High |
| Data Engineer | Data infrastructure | Very High |
| Analytics Engineer | Metric modeling | Growing |
| Data Scientist | Advanced analytics | High |
| ML Engineer | Model deployment | Growing |
| Governance Specialist | Data trust | Growing |
| Analytics Translator | Business alignment | Growing |
Skills That Increase Career Demand
Technical skills
- SQL and data modeling
- Python for analysis
- BI tools proficiency
- Cloud platform basics
Non technical skills
- Business understanding
- Clear communication
- Problem solving
- Ethical awareness
Future Career Trends
Hybrid roles will increase. Business and technical skills will merge. AI literacy becomes essential. Governance knowledge gains importance. Continuous learning remains necessary.
In Short
Data analytics careers offer strong growth. Roles suit different interests and strengths. Demand continues across industries. Skills determine long term success. Learning continuously improves opportunities.
Conclusion
Data analytics continues shaping modern business decisions in 2026. Organizations rely on data for speed and accuracy. Advanced tools make analytics easier for everyone. AI improves insights and future predictions. Real time analytics supports faster actions. Self service tools empower business teams daily.
Career opportunities in analytics keep growing steadily. Demand spans technical and business focused roles. Strong fundamentals remain very important. Ethical and governed data builds long term trust. Continuous learning ensures career stability. Data driven professionals stay competitive in future.
Frequently Asked Questions
What is data analytics and why is it important in 2026?
Data analytics is the process of collecting, cleaning, analyzing, and interpreting data to support better decisions. In 2026, businesses rely on data analytics to respond faster to market changes, reduce risks, improve customer experiences, and stay competitive in data-driven industries.
How is data analytics different from Business Intelligence (BI)?
Business Intelligence mainly focuses on reporting, dashboards, and understanding past and current performance, while data analytics goes deeper by explaining why things happened and predicting future outcomes using advanced techniques like machine learning and statistical models.
What are the most important data analytics trends to watch in 2026?
Key trends include augmented analytics, AI and machine learning-driven insights, real-time analytics, self-service BI tools, and strong focus on data governance and ethics, all of which aim to make analytics faster, more accessible, and more trustworthy.
What is augmented analytics and how does it help businesses?
Augmented analytics uses artificial intelligence to automate data preparation, analysis, and insight generation, helping business users find meaningful insights quickly without deep technical skills, which increases analytics adoption across teams.
Why is real-time analytics becoming more important?
Real-time analytics allows organizations to analyze data instantly as events occur, enabling immediate responses to fraud, system failures, customer behavior changes, and operational issues, which helps prevent losses and improves decision speed.
What skills are required to build a career in data analytics?
A strong data analytics career requires skills in SQL, data visualization tools, basic statistics, Python or R, understanding of business concepts, communication skills, and increasing awareness of AI, cloud platforms, and data governance principles.
Which tools and technologies should beginners learn first?
Beginners should start with SQL for data querying, a BI tool like Power BI or Tableau for visualization, and basic Python for data analysis before moving to cloud platforms, real-time tools, and machine learning technologies.
What career roles are available in data analytics?
Common roles include Data Analyst, BI Analyst, Data Engineer, Analytics Engineer, Data Scientist, Machine Learning Engineer, Data Governance Specialist, and Analytics Translator, each focusing on different aspects of data usage and decision making.
Why are data governance and ethics critical in analytics?
Data governance and ethics ensure data accuracy, privacy, compliance, and fairness, helping organizations build trust with customers and stakeholders while avoiding legal risks and biased or harmful decision-making outcomes.
How can professionals stay relevant in data analytics careers?
Professionals can stay relevant by continuously learning new tools, improving business understanding, practicing ethical data usage, building real-world projects, and adapting to emerging trends like AI-driven analytics and automation.


