
Table of Contents
Introduction
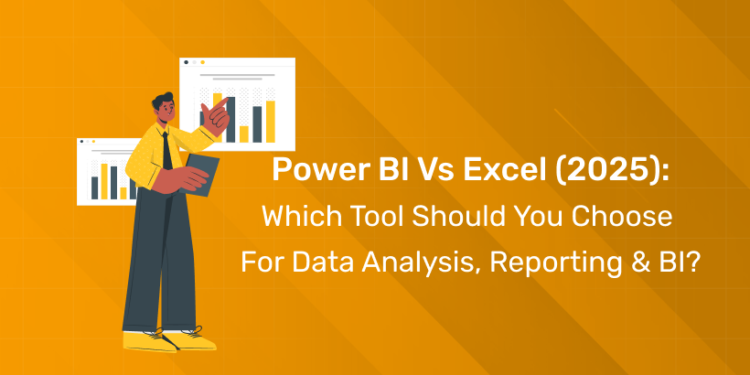
If you look at data as the “new oil”, the tools that are used to make it work can make the performance refined and intact. Excel has been the universal language of data for decades in almost every office function like finance, operations and HR. Power BI, on the other hand, has grown into modern analytics and BI platforms that are built for interactive dashboards with real-time data.
In 2025, the comparison between the two – Power BI and Excel – is crucial with the rapid shift to cloud collaboration, AI, Microsoft Fabrics among others. Keep reading to explore the detailed comparison of their features, real-time cases and a practical framework to make informed decisions which tool is right for you.
What are Excel and Power BI?
Microsoft Excel
![]() A spreadsheet application used for data entry, calculations, modelling and ad hoc analysis that features formulas, tables, charts and other formatting tools. It is bundled with Microsoft 365 and has been the default analytics tool for professionals across various industries.Since the 1980, it has powered almost every dataset from budget sheets to complex data models. It is flexible, easy to learn and perfect for small datasets.
A spreadsheet application used for data entry, calculations, modelling and ad hoc analysis that features formulas, tables, charts and other formatting tools. It is bundled with Microsoft 365 and has been the default analytics tool for professionals across various industries.Since the 1980, it has powered almost every dataset from budget sheets to complex data models. It is flexible, easy to learn and perfect for small datasets.
Power BI
![]() It is Microsoft’s business intelligence platform connecting many data sources and models. It delivers interactive reports and dashboards through desktop and cloud services. Designed for scalable, governed analytics, Power BI enables teams to explore large datasets and refresh data automatically. It transforms static reports and interactive insights.Both these tools continue to evolve. Excel now integrates Copilot AI, while Power BI leverages Microsoft Fabric and advanced AI-driven visuals.
It is Microsoft’s business intelligence platform connecting many data sources and models. It delivers interactive reports and dashboards through desktop and cloud services. Designed for scalable, governed analytics, Power BI enables teams to explore large datasets and refresh data automatically. It transforms static reports and interactive insights.Both these tools continue to evolve. Excel now integrates Copilot AI, while Power BI leverages Microsoft Fabric and advanced AI-driven visuals.
Feature Comparison — Side by Side
| FEATURE | EXCEL | POWER BI |
| Data Capacity / Row Limits | 1 million rows per sheet;Struggle with very large or complex models | Handles millions of rows efficiently; columnar storage and compression |
| Performance | May slow down with heavy formulas, links and large files | Optimized for fast, interactive queries, scheduled refresh from multiple sources |
| Data Modelling and Transformation | Power Query, formulas, pivot tables; file-centric modelling | Robust semantic models, relationships, Power Query, DAX and M for complex queries |
| Visualization & Interactivity | Static charts and basic dashboards;Limited interactivity | Rich, interactive visuals, drill-downs, cross-filtering, advanced dashboarding |
| Collaboration & Sharing | File-based via email, OneDrive or SharePoint;Version conflicts possible | Cloud-based sharing via Power BI Service, apps and workspaces wit role-based access |
| Automation & AI | Macros/VBA, Power Query refresh, Excel Copilot for formulas and analysis | Scheduled refresh, dataflows, AI visuals, natural language Q&A, and Copilot for insights |
| Security & Governance | Depends on file location and sharing rules;Harder to centrally govern | Centralized governance, row‑level security, auditing, and compliance controls |
| Cost and Licensing | Included in most Microsoft 365 plans;Predictable per user pricing | Power BI desktop is free;Pro and Premium require extra per user or capacity licenses |
| Ease of Learning | Very low barrier to entry | Requires BI mindset and understanding of data modelling |
Join Our Online Data Analytics Course!
Real-World Use Cases / Case Studies
Small Business: Excel for Financial Reports
Excel is often the fastest way to manage monthly P&L statements and cashflow trackers. It is increasingly used in preparing simple sales reports, especially when a single owner or accountant controls the file. Its functions, grid interface and pivot tables are ideal for hands-on financial modelling.
Mid-Sized Company: Power BI for Interactive Dashboards
Power BI is the appropriate choice for a growing mid-sized company with multiple branches. It offers smooth handling while consolidating sale, inventory and CRM data into a single interactive dashboard with daily updates. Leaders can sort performance by region, channel and product line without handling any formulas. The analysts manage the data model behind the scenes.
Enterprise Hybrid Workflow
A hybrid workflow is on demand for large enterprises. Data is entered and organized in Excel or exported from ERP systems. They are then published into Power BI for governance, visualization and distribution to hundreds or thousands of users. The combination reduces manual reporting efforts, minimizes errors and gives a single source of accurate data.
When to Use Excel, When to Use Power BI, When to Use Both
Choose Excel if
Excel is the better primary tool when you work with relatively small to medium datasets. If your reports are meant for small groups and you need hands-on modelling, you can go with Excel. It shines for ad hoc analysis, one‑off reports, templates, financial models, and situations where flexible formatting matters more than strict governance.If you are not equipped with BI skills and your stakeholders are deeply comfortable with spreadsheets, Excel is the ideal choice. Let your data live in simple files rather than multiple online systems just like that.
Choose Power BI if
Power BI is the better choice when you are dealing with large, fast‑growing datasets. When you need interactive dashboards this comes in handy. You can deliver governed, reusable reports to many users seamlessly. It is ideal for:
- KPIs
- Executive dashboards
- Self‑service BI portals, and
- Multi‑source analytics that require scheduled refresh and security controls.
Choose Power BI if you want real‑time or near‑real‑time views of operations, cloud‑based access (including mobile apps), and clear role‑based access control.
Use Both in Collaboration if
For many organizations, the best strategy is working together with Excel and Power BI in a single pipeline. To make this possible you just need to clean and validate data in Excel or Power Query. Then connect that file to Power BI and publish dashboards. Analysts keep their modelling flexibility in Excel. Business users enjoy consistent, interactive views in Power BI without worrying about formulas.This hybrid approach also makes adoption smoother: you do not have to abandon Excel overnight. Instead, you gradually layer Power BI on top of your existing reporting culture.
Performance & Limitations
Excel’s main performance limitation is file size and complexity: heavy use of volatile formulas, multiple pivot tables, and links across workbooks can quickly make files slow and fragile. It also caps rows per sheet and is not optimized for querying very large relational datasets.Power BI is built for large models but has its own constraints. This applies especially around dataset sizes in shared workspaces and Premium capacities. Performance depends on good data modelling, efficient DAX, and sufficient capacity. Poorly designed models can still feel sluggish even in Power BI.Refresh rates are another key difference. Excel usually depends on manual or periodic refreshes. On the other hand, Power BI supports scheduled and near‑real‑time streaming from supported sources. However, refresh frequency may be limited by licensing tiers and infrastructure.
Cost Analysis
For most individuals and small teams, Excel is effectively “already paid for” as part of Microsoft 365 subscriptions. This makes it a very cost‑effective analytics tool. There is no extra per‑report or per‑dataset cost beyond your existing licenses.Power BI Desktop is free for report creation. But sharing dashboards typically requires Power BI Pro or Premium licenses. Pro is usually priced around 10 to 15 USD per month for each user. On the other hand, Premium is billed per user at a higher rate or by capacity for large organizations.When comparing total cost of ownership, you have to consider not only license costs but also training, support, governance setup, and the potential savings. This ranges across automated reporting and reduced manual effort. For enterprises, Power BI often pays off by centralizing analytics and reducing redundant reports spread across hundreds of Excel files.
Security, Governance & Compliance
Excel is fundamentally file‑based.
- Security depends on where files are stored (local drives vs OneDrive/SharePoint)
- Sharing settings, and
- Any additional controls like sensitivity labels.
Version sprawl and uncontrolled sharing can become issues, especially when spreadsheets are emailed without proper governance.Power BI, by contrast, centralizes content in workspaces with defined roles, allowing administrators to manage row‑level security and apply organization‑wide policies. It also integrates with Microsoft’s broader compliance stack. This makes it better suited to regulated industries that need strong data governance.To handle highly sensitive or regulated data use Excel only as a front‑end for limited analysis while keeping core models and dashboards in Power BI.
Skill Requirements & Learning Path
Excel is generally easier to start with. Most professionals learn basic formulas, sorting, filtering, and simple charts quickly, then progress to pivot tables and possibly VBA macros. Countless tutorials, courses, and templates make it very approachable for non‑technical users.Power BI requires:
- understanding data modelling concepts (relationships, star schemas)
- Power Query for ETL, and
- DAX for measures and calculations.
While the interface is user‑friendly, building robust, reusable models and reports is more akin to “lightweight data engineering” than spreadsheet work.A practical learning path in 2025 is to master intermediate Excel (including Power Query). Then you can transition into Power BI using that knowledge. Eventually adding DAX and governance concepts closes the deal. Certifications, online bootcamps, and active communities on platforms like Microsoft Learn, LinkedIn, and specialized training sites support this journey.
Join Our Online Data Analytics Course!
Future Trends
 Microsoft Fabric and OneLake aim to unify data across the Microsoft ecosystem, making it easier for both Excel and Power BI to tap into governed, organization‑wide datasets. In this model, Excel becomes a flexible “front‑end” for exploration, while Power BI acts as the enterprise BI layer on top of shared data.AI is becoming a first‑class citizen in both tools: Excel Copilot helps generate formulas, summaries, and charts, while Power BI Copilot can suggest visuals, measures, and narrative insights. Over time, this will lower the skill barrier and push both tools toward more natural‑language, assisted analytics experiences.The broader trend is a shift from isolated spreadsheets toward cloud‑based, collaborative BI where Excel and Power BI increasingly work together rather than compete. Expect deeper embedding of Power BI content inside Excel and vice versa, making the “Excel vs Power BI” debate less about replacement and more about complementarity.
Conclusion
The choice between Excel and Power BI in 2025 is no longer an either-or decision. It is increasingly a both-and strategy. Excel has proven its lasting impact over decades for very strong reasons. They range from it being intuitive, flexible, and the way it handles the vast majority of everyday analytical tasks with ease. A good range of professionals worldwide rely on formulas, pivot tables, and spreadsheet workflows and that is not changing anytime soon. In 2025, Microsoft’s broader vision – Microsoft Fabric, deeper AI integration, and tighter Excel-Power BI coupling – will make this blended workflow more seamless than ever. Organizations that embrace both tools will find themselves moving faster, making better decisions, and building analytics cultures that scale.
Frequently Asked Questions
1. Which is better for beginners: Power BI or Excel?
Excel is generally better for beginners because its grid interface is smooth. Moreover, the basic functions, charts, and pivot tables are easy to learn. Power BI is still accessible but requires some familiarity with data modelling and concepts like relationships and measures.
2. Can Power BI replace Excel completely?
For most organizations, Power BI will not completely replace Excel. Instead, they complement each other. Excel remains crucial for modeling, templates, and quick analysis. Power BI handles interactive dashboards, large datasets, and governed sharing.
3. Is Excel still relevant for data analysis in 2025?
Yes, Excel is still extremely relevant for data analysis in 2025. Most professionals already know Excel, making it a practical starting point for analytics.
4. Which tool is better for dashboards?
Power BI is better for dashboards due to its rich, interactive visuals, and optimized web as well as mobile viewing. Excel can create dashboard‑style reports but lacks the same level of interactivity and scalability.
5. How do data limits compare between Excel and Power BI?
Excel worksheets are limited to about one million rows. It has a good chance of slowing down with complex formulas and multiple pivot tables. Power BI can efficiently handle millions of rows in its in‑memory models. This makes it better for large‑scale analytics.
6. How do costs differ between Power BI and Excel?
Excel is part of most Microsoft 365 subscriptions. So there is usually no additional cost for basic analytics. Power BI Desktop is free, but sharing dashboards typically requires Power BI Pro or Premium licenses with separate per‑user or capacity fees.
7. Which tool is better for finance teams?
Finance teams typically use both. Excel is for detailed models, budgeting templates, and scenario analysis. Power BI is for consolidated dashboards and management reporting. Power BI is especially helpful for rolling up data from multiple entities or systems into a single view.
8. Do I need coding skills to use Power BI?
You can build basic reports in Power BI without coding, using drag‑and‑drop visuals and simple modeling. For advanced analytics and optimized models, learning DAX and some M for Power Query is highly beneficial but not mandatory.
9. Which should I learn first for a data career?
For most beginners, learning Excel first is sensible because it builds core data skills. Once comfortable with Excel and Power Query, moving to Power BI unlocks more advanced BI roles and typically higher‑paid opportunities.
10. Is Power BI harder to learn than Excel?
Power BI has a steeper learning curve as it involves data modelling, Power Query, and DAX, which are new concepts for many Excel users. However, Excel experience provides a strong foundation.


