Table of Contents
An instrument used by trend traders in technical analysis to evaluate market momentum is the Relative Strength Index, or RSI for short. The time-tested RSI charting tool is still a favorite trading indicator among traders even if it’s not a guarantee for precise market predictions. In this article, we will examine what is RSI and how it’s used to analyze market patterns in more detail.
Start investing like a pro. Enroll in our Stock Market course!
What Is RSI (Relative Strength Index)?
Technical indicators that are frequently employed in financial markets include the Relative Strength Index (RSI). An asset’s price changes are measured by this momentum oscillator, which also tracks its change in speed. Potential overbought and oversold market circumstances can be identified by traders and investors with the use of the RSI, which provides a n
How To Use RSI?
1: What is a stock?
Traders usually take a few crucial measures in order to use the Relative Strength Index (RSI) in trading. In order to determine probable overbought or oversold conditions, they first compute the RSI, which fluctuates between 0 and 100. A price correction and possible sale opportunity are indicated by an RSI above 70, which shows an asset may be overbought. Conversely, a price correction and possible buy opportunity are suggested by an RSI below 30, which suggests an asset may be oversold and undervalued. When the RSI swings against the price, signaling potential trend reversals, traders also search for RSI divergence. To validate signals and improve trade choices, RSI can also be used in conjunction with other technical indicators and chart patterns. umerical number between 0 and 100.
How RSI Is Calculated?
The following formula is used to determine the value of the RSI indicator:
RSI = 100 – 100 / (1 + RS)
Where RS is the average gains over x periods / average losses over x periods.
The RSI is essentially a percentage representation of the ratio of profitable price closures to unprofitable price closes.
The indicator value will fluctuate between 0 and 100 because it is displayed as a percentage.
How To Set And Adjust RSI Indicator?
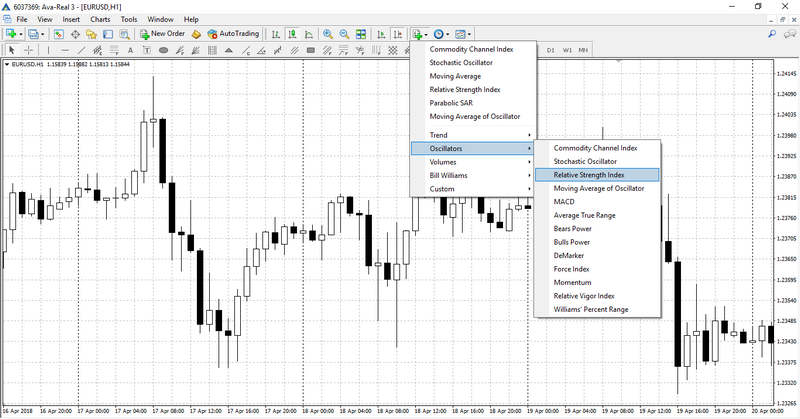
This indicator can be set up in two different ways. The simplest method is to choose “Oscillators” – “Relative Strength Index” under the “List of Indicators” tab on the terminal’s upper panel.
Alternatively, you could select “Insert,” “Indicators,” “Oscillators,” and “Relative Strength Index.”
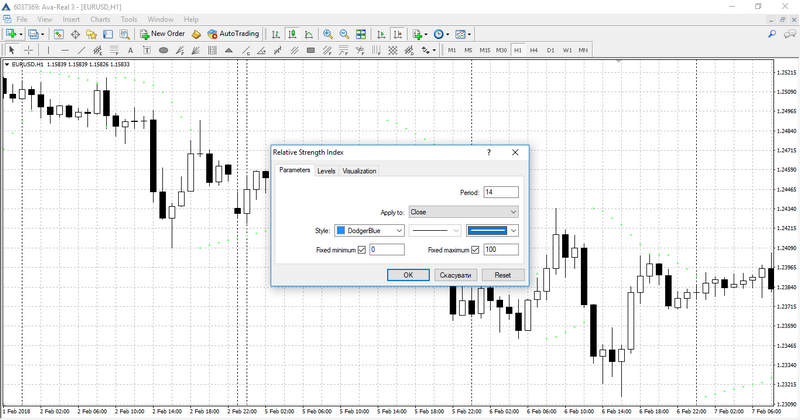
Prior to the indication being set in the chart, the instrument setup window will pop up. You can adjust the parameters of the indicators using this window. The period, which specifies the number of price values taken into account when drawing the main indicator’s line, is the primary parameter. The chart movements of the indicator will be steeper the shorter the period. By default, this option is set to 14, which is generally regarded as the ideal value. It is also possible to modify the style parameters, such as line weight and color. The settings window’s other tab allows you to modify the level parameters from 30 and 70 to 20 and 80. In the event that your strategy calls for it, you can also create further levels.
Start investing like a pro. Enroll in our Stock Market course!
RSI Trendlines
Relative Strength Index (RSI) is not a trailing indicator, unlike what many people think. On the RSI chart, trendlines can be used to observe this quality, and its break can be traded. An upward trendline is created by joining two or more low points and extending the line into the future when the RSI is increasing. Likewise, in the event of a declining RSI, a downward trendline is created by joining two or more high points and extending the line ahead of time. Before a real price reversal or continuation in the market, there is a break of an RSI trendline.
Stock Market Training Reviewed & Monitored by SEBI Registered RA
Trusted, concepts to help you grow with confidence. Enroll now and learn to start investing the right way.
Know moreRSI And Chart Patterns
When combined with line chart patterns or raw price action indications, the Relative Strength Index is one of the greatest technical indicators. For example, if a downtrending pin bar or other bullish candlestick exhibits a reading of below 30, indicating oversold conditions, then a buy position can be opened.
RSI Trading Strategy
A set of guidelines and tactics known as an RSI trading strategy makes use of the RSI indicator to pinpoint possible trading entries based on momentum shifts and overbought and oversold positions. Utilizing the RSI indicator in trading may be done in four main methods.
Overbought and Oversold
An asset may experience a price decline if the RSI indicator indicates it has gotten overbought and then begins to point lower. Similarly, if the RSI is oversold and then begins to trend upward, there may be an impending increase in price.
If you use this RSI trading method, you might want to hold off on taking a potential short position until the RSI drops below the 70 from an overbought condition level. Next, the plan is to enter a long position when the oversold conditions cause the RSI to move over 30.
RSI Divergence
A useful idea in technical analysis, RSI divergence can provide information about impending market reversals and trend continuations. When the direction of the price action of the underlying asset deviates from the direction of the RSI indicator, this is known as divergence. The two primary forms of divergence in the RSI are: Bearish divergence and Bullish divergence.
Bearish Divergence
An asset’s price making higher highs while the RSI making lower highs is known as bearish divergence. As a result, it appears that there may be a possible downward reversal even in the face of rising prices. In anticipation of a drop in price, traders use this as a signal to sell or short the asset. When an uptrend ends and a new downward trend begins, bearish divergence can be used to spot it.
Bullish Divergence
When the RSI makes higher lows and the asset’s price makes lower lows, this is known as a bullish divergence. This shows that even while prices are falling, the downward momentum is beginning to wane, pointing to a possible upside turnaround. Because they believe the asset’s price will start to rise, traders frequently view this as a buying opportunity. When a downtrend is coming to a close and a new upward trend is starting, bullish divergence can be quite helpful.
50-crossover
The RSI 50 level, often known as the centerline, can be used by traders to verify the existence of a market trend. This technique states that the confirmation of a falling trend occurs when the RSI crosses from above 50 to below 50. In a similar vein, an upward trend is verified by an RSI crossing above 50.
RSI failure swings
On a much smaller scale, this idea is comparable to divergence. Small highs and lows that a price makes during a trend are known as “swings.” The price’s highs and lows are typically followed by the RSI.
Highs and lows are higher in uptrends. Lower highs and lows are seen in downtrends. A brief trend reversal may be indicated if the price rises as the RSI swings lower.
ENTRI’S Stock Market Course
Entri Finacademy Stock Market Course is the best online stock market course, which equips you with the knowledge and skills you need to successfully navigate the complexities of stocks. It offers in-depth training. Proficient instructors provide knowledge ranging from basic principles of trading to advanced strategies, employing real-life scenarios and models to offer valuable perspectives on risk, diversification, and evaluation. You may make informed financial decisions with the help of this course, which is appropriate for students of all ability levels. Enroll today to start your journey to becoming a confident investor.
Start investing like a pro. Enroll in our Stock Market course!
CONCLUSION
When assessing the strength of price moves for different financial instruments, RSI is a widely utilized technical analysis tool. J. Welles Wilder Jr. created it, and it shows traders possible trend reversals as well as overbought or oversold levels, offering insightful information. Traders can customize the conventional 14-period setting for the RSI, but it can be applied to other timeframes and durations as well. For instance, to enhance sensitivity to current price changes, daytrading RSI settings are usually adjusted for a shorter lookback, such 7 or 10 periods. But RSI is not without its limits. It can generate false signals and cannot forecast the size of price reversals. For traders attempting to understand the intricacies of financial markets, RSI is still a helpful indicator in spite of these disadvantages.
Stock Market Training Reviewed & Monitored by SEBI Registered RA
Trusted, concepts to help you grow with confidence. Enroll now and learn to start investing the right way.
Know moreFrequently Asked Questions
What are the limitations of RSI?
Similar to other technical indicators, RSI is not infallible and can provide false indications. During strong trends, it can stay in overbought or oversold circumstances for extended periods of time, causing traders to enter or quit trades too soon. It should therefore be used in conjunction with other tools and analysis techniques.
Can RSI be used with other indicators?
Yes, to confirm signals and improve trade decisions, RSI is frequently used in conjunction with other technical indicators and chart patterns. Indicators like Bollinger Bands, Moving Averages, and MACD are frequently coupled.
Can RSI be used for all types of assets?
Indeed, a wide range of assets, including stocks, currency, commodities, cryptocurrencies, and indexes, can be used using RSI. It is a flexible tool that performs admirably in a variety of settings.
How often should RSI be monitored?
The time range and strategy of the trader determine how often they monitor RSI. While swing or position traders may check RSI once a week or more, day traders may check it many times during the day.


