Table of Contents
Candlestick patterns are used for predicting the future direction of the price movements. These are used to identify trading patterns that help technical analyst set up their trades. In this blog, we will discuss about 15 powerful candlestick patterns.
What is Candlestick?
Candlestick is a way of displaying information about an asset’s price movement. The candlestick patterns are formed by grouping two or more candlesticks in a certain way. Individual candlesticks form patterns that traders can use to recognize major support and resistance levels.
Candlestick type of charting has been in use since the 17th century. A Japanese man known as Homma discovered that as there was a link between price and the supply and demand of rice. Japanese traders had since then used candlestick in the rice markets. Japanese candlesticks pattern generally comprise of one, two or a maximum of three candles.
Start investing like a pro! Enroll in our Stock Market course!
How to Read a Candlestick Pattern?
A daily candlestick represents a market’s opening, high, low, and closing (OHLC) prices. Candlestick chart has three basic features:
Body: It represents the open-to-close range
Wick, or shadow: It indicates the intra-day high and low.
Color: It reveals the direction of market movement. A green (or white) body indicates a price increase, whereas a red (or black) body shows a price decrease.
Taken together, the parts of the candlestick can frequently signal changes in a market’s direction or highlight significant potential moves that frequently must be confirmed by the next day’s candle. The best way to learn to read candlestick patterns is to practice entering and exiting trades from the signals they give.
Interested in Learning More About Stock Marketing? Explore Here!
15 Different Candlestick Patterns
There are a great many candlestick patterns that indicate an opportunity within a market – some provide insight into the balance between buying and selling pressures, while others identify continuation patterns or market indecision.
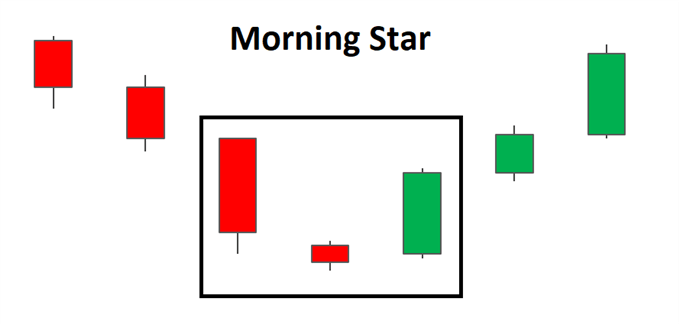
Morning Star
A Morning star is a bullish three candle pattern which is formed at the bottom of a down move. It is made of 3 candlesticks, the first being a bearish candle, the second a Doji and the third being a bullish candle. The first candle shows the continuation of the downtrend. The second candle being a doji indicates indecision in the market. The third bullish candle shows that the bulls are back in the market and reversal will take place.
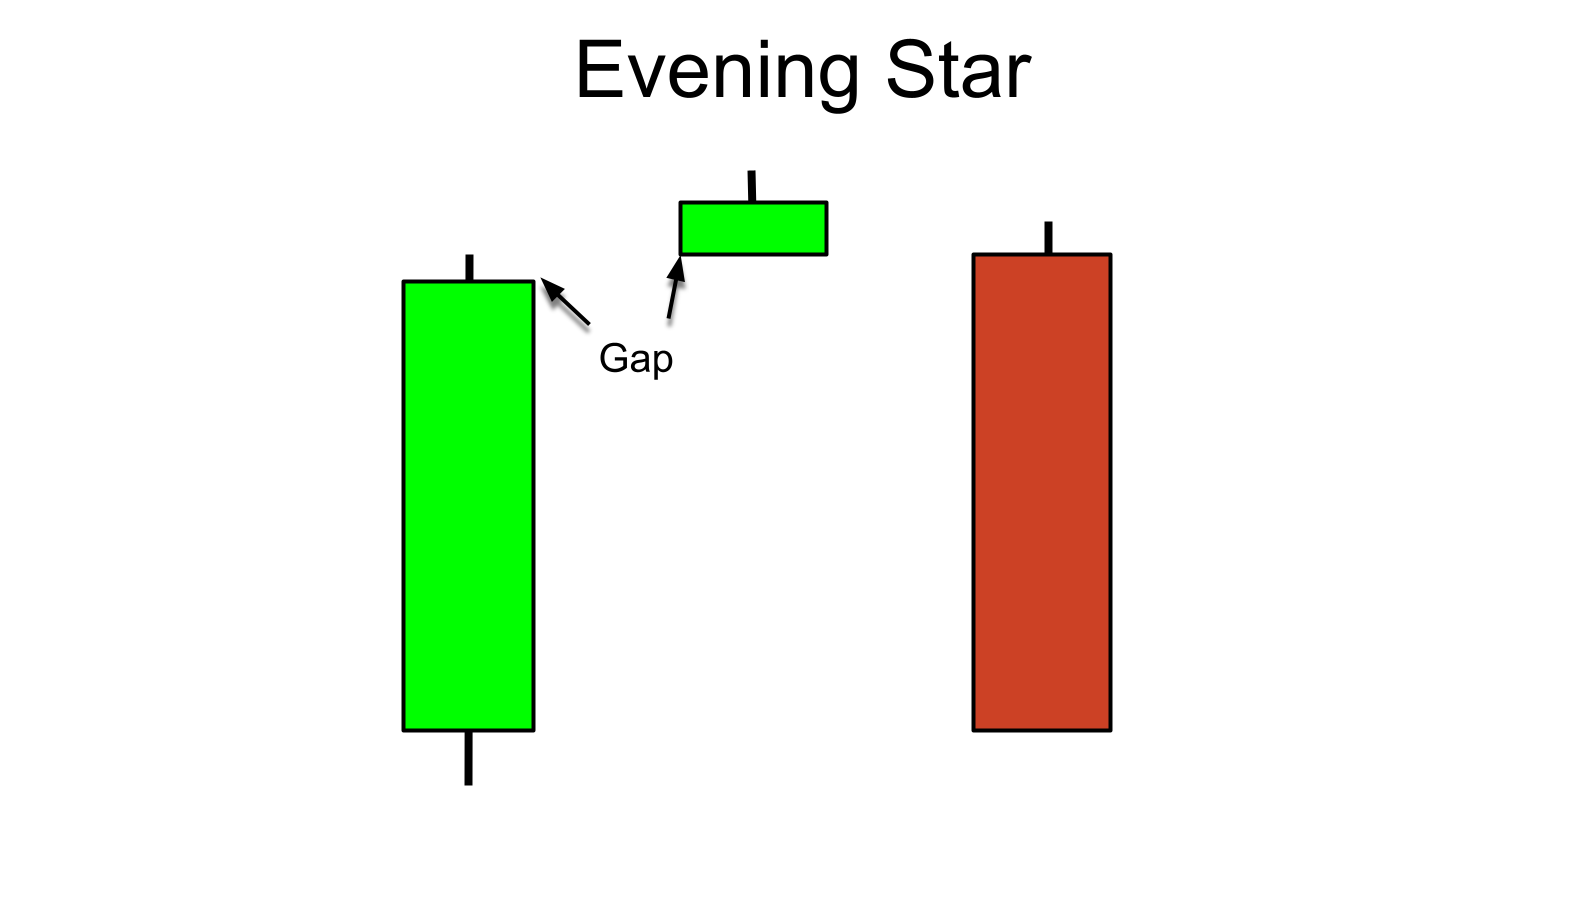
Evening Star
An evening star is the exact mirror image of a morning star. The first candle is a long bullish candle which is followed by a small candle which ideally should be a Doji candle. The third candle is a long bearish candle which signals the end of the bull move.
Start investing like a pro! Enroll in our Stock Market course!
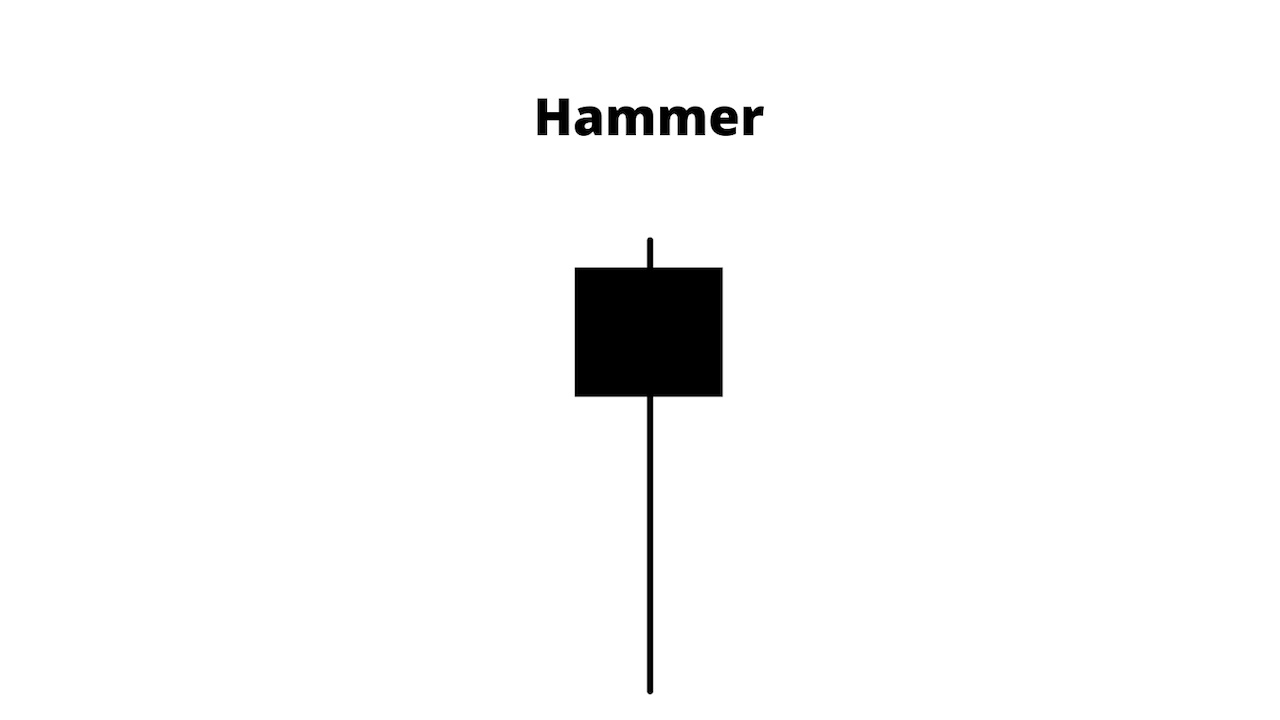
Hammer
It is formed of a short body with a long lower wick and is found at the bottom of a downward trend. A hammer shows that although there were selling pressures during the day, ultimately strong buying pressure drove the price back up. Green hammers indicate a stronger bull market than red hammers.
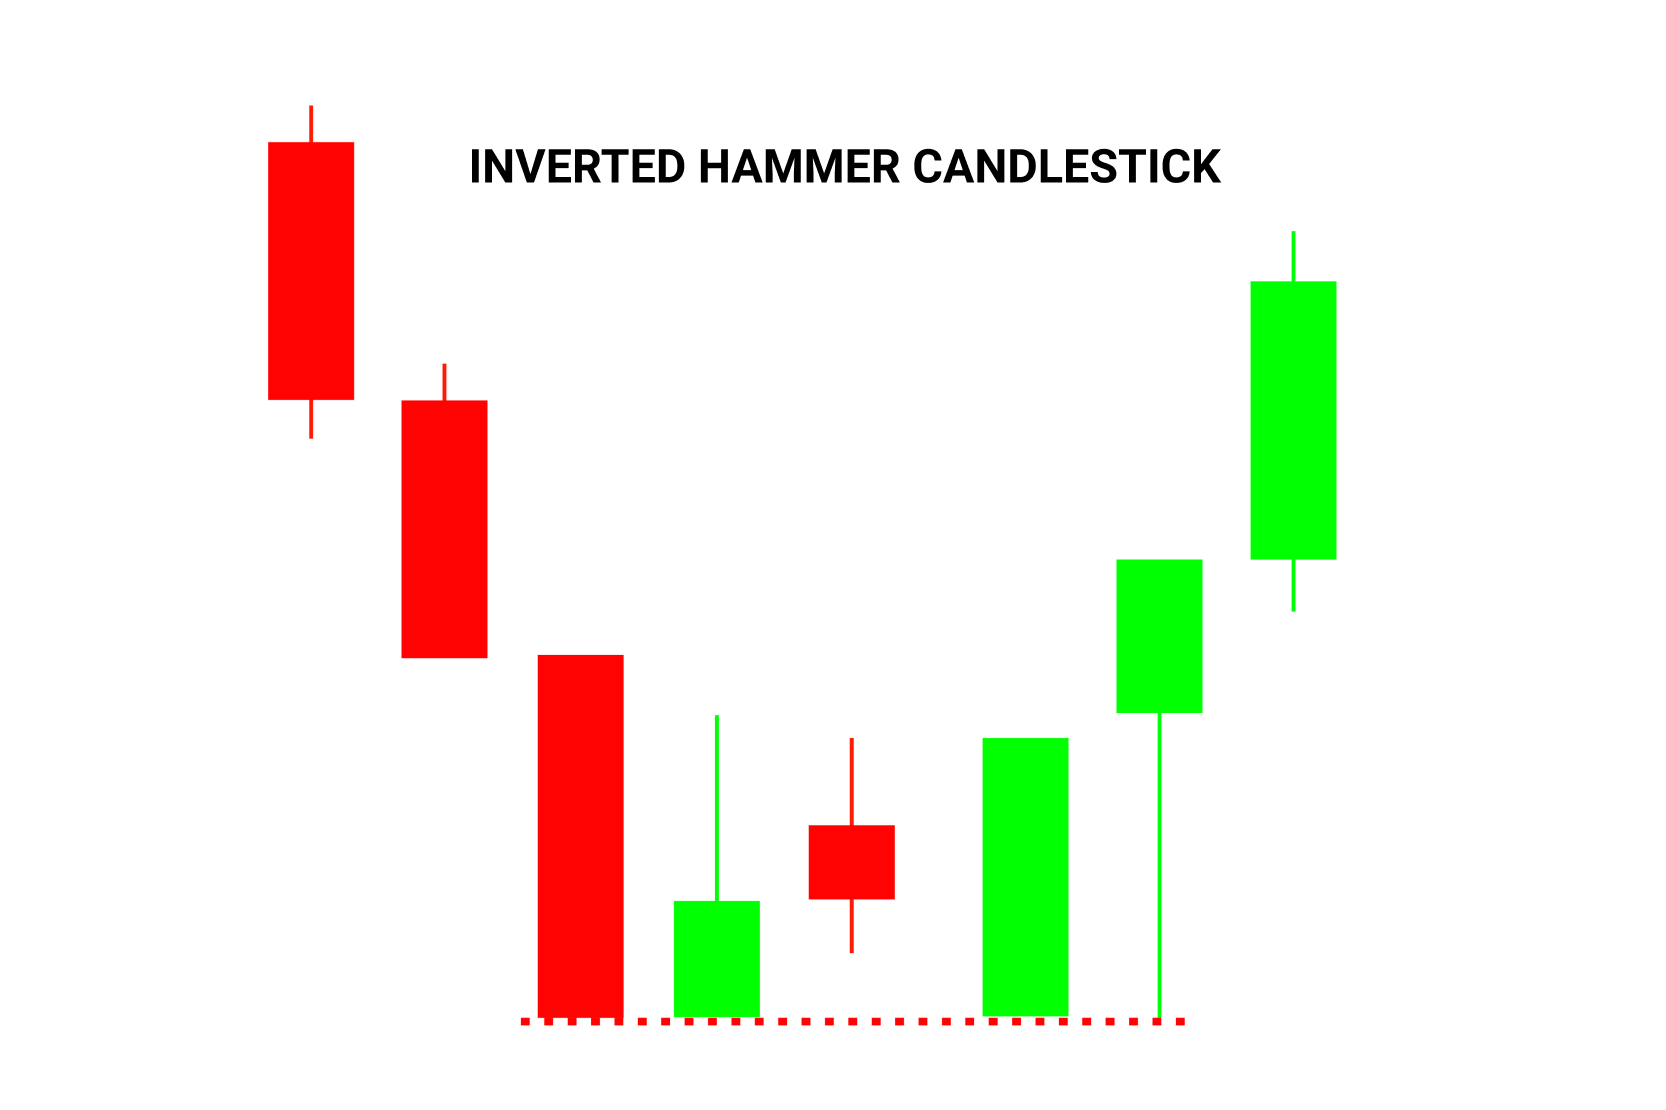
Inverted hammer
The inverted hammer is the inverse of hammer in which the upper wick is long and the lower wick is short. It suggests that buyers will soon have control of the market as the selling pressure is not strong enough to drive the market price down.
Piercing Pattern
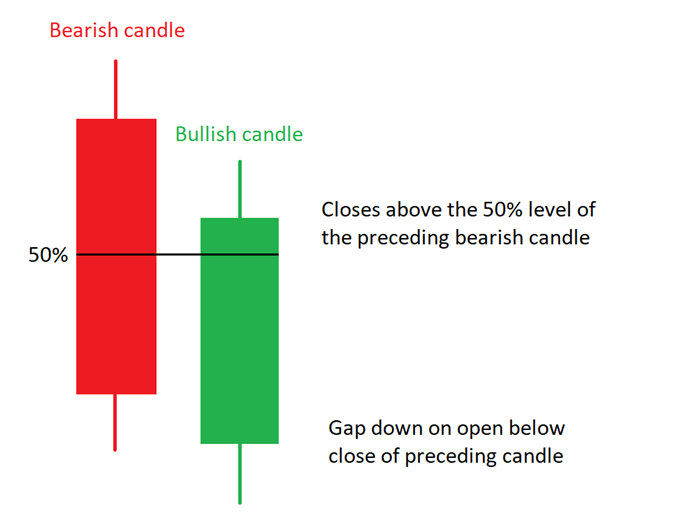
It is a multiple candlestick chart pattern formed after a downtrend indicating a bullish reversal. Two candles form the piercing pattern. The first candle is a bearish candle which indicates the continuation of the downtrend. The second candle is a bullish candle which opens the gap down but closes more than 50% of the real body of the previous candle, which shows that the bulls are back in the market and a bullish reversal is going to take place.
Doji
These are the easiest to identify candlestick pattern as their opening and closing price are very close to each other. It looks like a plus sign which implies that a market’s open and close are almost at the same price point. Alone a doji is neutral signal, which signals an end of the previous move.
Engulfing Pattern
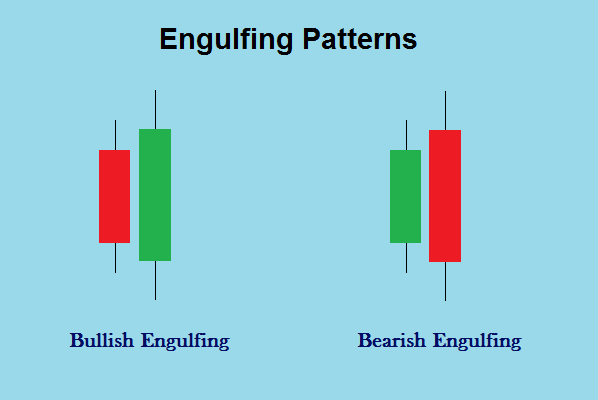
It is one of the most powerful patterns in candlesticks. It occurs when the second candle completely overshadows or engulfs the previous candle. Symbolically it means that buyers have overpowered the sellers or vice versa.
There are two type of Engulfing patterns – Bullish Engulfing Pattern and Bearish Engulfing Pattern.
Bullish Engulfing pattern suggests that bulls have taken over from the bears and are likely to start an up move. They are an indicator for traders to consider opening a long position to profit from any upward trajectory.
Bearish Engulfing pattern signals that the bears have won the fight against the bulls and can push the stock downward. It signifies a peak or slowdown of price movement, and is a sign of an impending market downturn. Bearish candlestick patterns usually form after an uptrend, and signal a point of resistance.
Hanging Man
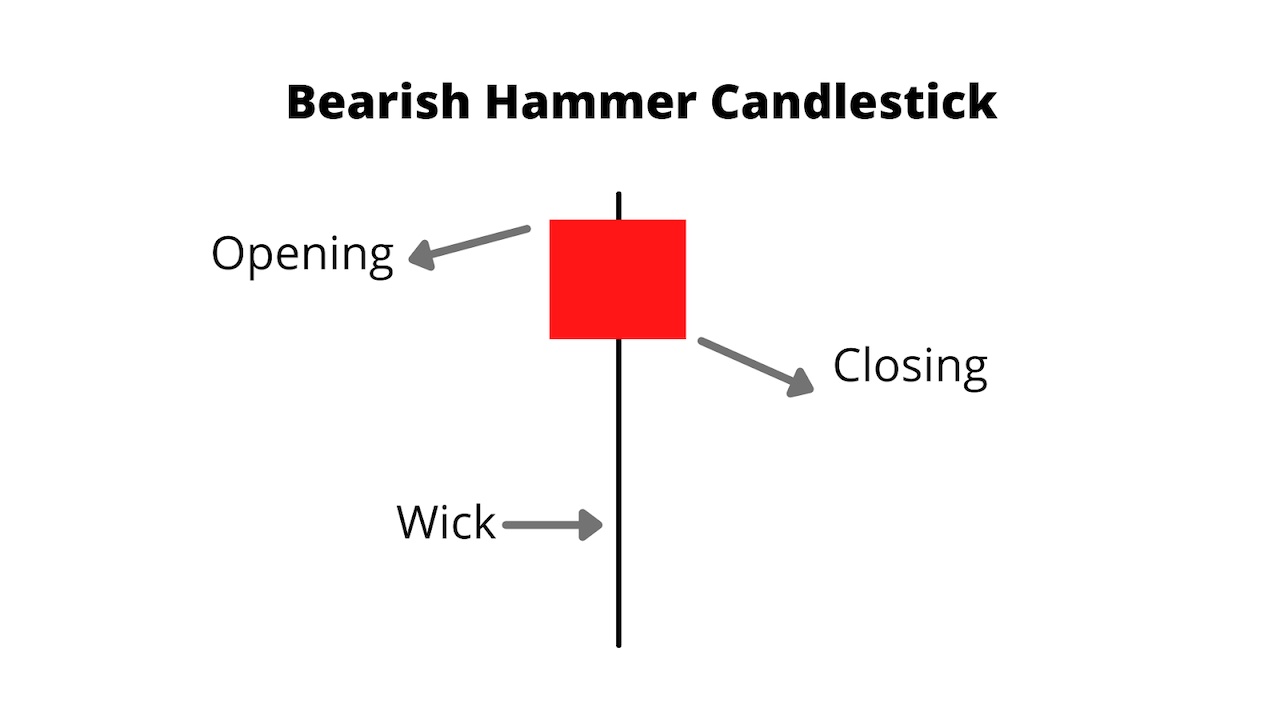
Also known as Bearish Hammer Candlestick, it is a single candlestick pattern which is formed at the end of an uptrend and signals bearish reversal. This candlestick pattern has no upper shadow. Hanging man suggests an important potential reversal lower and is the corollary to the bullish hammer formation. It indicates that there was a significant sell-off during the day, but that buyers were able to push the price up again.
Shooting star
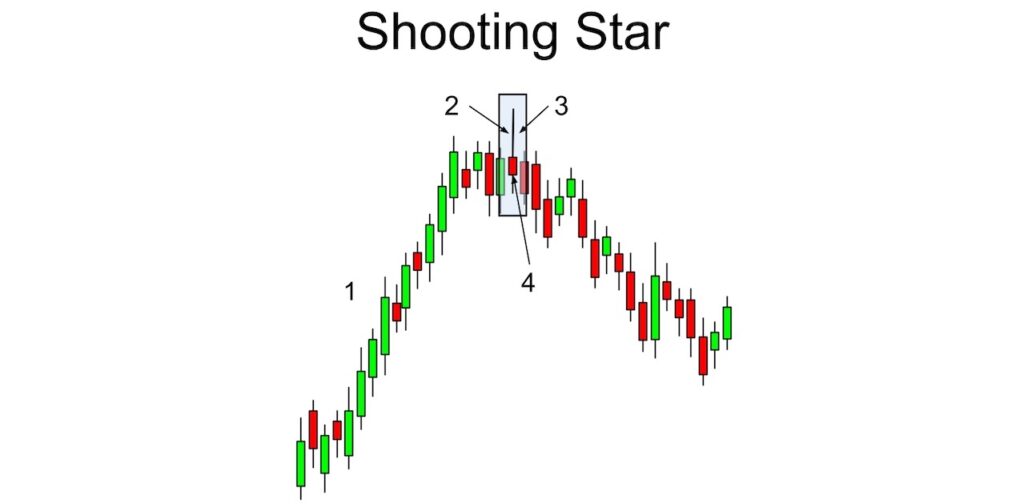
It has the same shape as the inverted hammer, but is formed in an uptrend. It has a small lower body and a long upper wick. This suggests that the market will gap slightly higher on opening and rally to an intra-day high before closing at a price just above the open
Three black crows
This candlestick is a multiple candlestick pattern which is formed after an uptrend indicating bearish reversal. This pattern comprises of three consecutive long red candles which do not have long shadows and with short or non-existent wicks.

Three Inside Up and Down
Three Inside Down is a multiple candlestick pattern which is formed after an uptrend indicating bearish reversal. It consists of three candlesticks – the first is a long bullish candle, the second candlestick is a small bearish which should be in the range the first candlestick and the third is a long bearish candlestick confirming the bearish reversal.
The Three Inside Up pattern is a bullish reversal candlestick pattern that contains a large down candle, a smaller up candle, and another up candle. The smaller up candle is always contained within the first large down candle, and the last up candle always closes (in price) above the closing price of the second candle.

Master stock trading with us! Enroll now for a free demo!
Three White Soldiers
This is also a multiple candlestick pattern that is formed after a downtrend indicating a bullish reversal. These candlestick charts are made of three long bullish bodies which do not have long shadows.

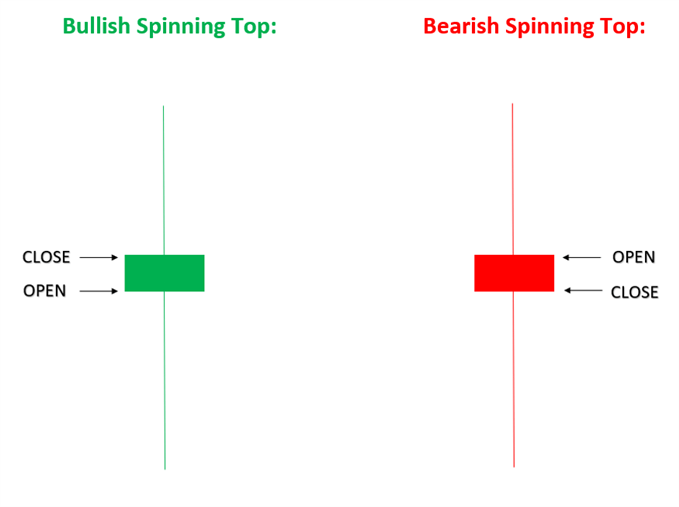
Spinning top
It has a short body centered between wicks of equal length. The pattern indicates indecision in the market. Spinning tops are often interpreted as a period of consolidation, or rest, following a significant uptrend or downtrend.
On-Neck Pattern
This pattern, also called a neckline, has a long real bodied bearish candle followed by a smaller real bodied bullish candle which gaps down on the open but then closes near the prior candle’s close.

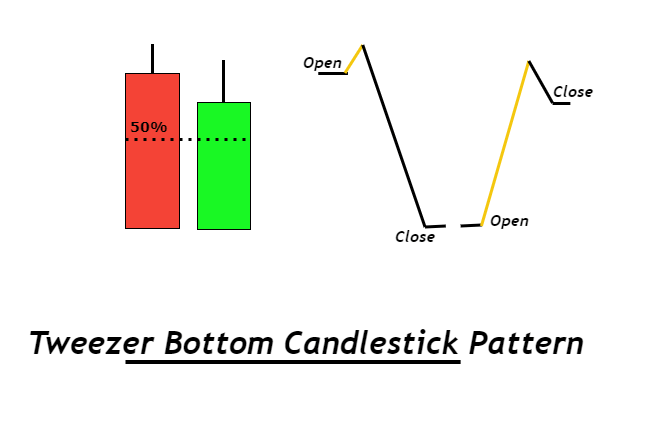
Tweezer Bottom
It consists of two candlesticks, the first one being bearish and the second one being bullish candlestick. When the Tweezer Bottom candlestick pattern is formed, the prior trend is a downtrend.
Learn Stock Marketing with Share Trading Expert! Explore Here!
Candlesticks are more useful than traditional open, high, low, close bars or simple lines that connect the dots of closing prices. In candlesticks each candle has a story to tell. So if you miss one, probably you would miss the next big move. It is always a good practice to use candlesticks alongside other forms of technical analysis to confirm the overall trend.


