

Table of Contents
A data analyst is a professional collects data, processes and analyzes data to help companies make better decisions. They work with devices such as spreadsheets, databases and programming languages to obtain useful insights from data. It can help identify trends, create reports and understand their performance, customer behavior or market trends.
For beginners, the path to become a data analyzer can seem heavy because of the skills and diversity of equipment. This step-by-step roadmap simplifies the journey by breaking the necessary skills and knowledge you need to learn. Whether you start now or change your career, this guide will help you understand what to learn, where to start and how to create a solid base in data analysis.
“Ready to take your data science skills to the next level? Sign up for a free demo today!”
Data Analyst Roadmap for Beginners
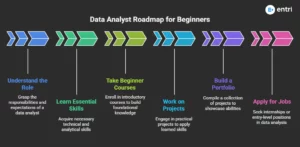
Step 1: Understand the Role of a Data Analyst
A data analyst enables companies make choices via looking at records. They accumulate facts, make it clear that it is accurate, after which examine it to find a sample. They use this facts to assist groups apprehend what is occurring, such as how many are going to a internet site or what products promote the maximum.
Responsibilities of a Data Analyst:
- Collecting Data: Data analysts collect data from different places, such as company databases, spreadsheets or online sources.
- Cleaning Data: They fix dirty data by removing errors or filling the missing information so that it is ready for analysis.
- Analyzing Data: Using math or data they look for trends, such as what products best perform, or why sales fall.
- Visualizing Data: They make charts, graphs or dashboards to display information in this way that is easy to understand.
- Reporting: They explain what data in reports or presentations to help the teams make decisions.
Skills Needed:
- Excel: For basic data work as organization and calculation of data.
- SQL: Language used to obtain data from the database.
- Data Visualization: Create diagrams and dashboards with devices such as Tableau or Power BI.
- Basic Math and Statistics: To understand trends and numbers.
- Python or R: Coding language is used for more complex data analysis.
Tools Used:
- Excel/Google Sheets
- SQL Databases
- Tableau/Power BI
- Python or R for advanced analysis.
Step 2: Learn the Essential Skills
To become a data analyst, you need to master some great skills. The most important thing here is that you should focus on:
1. SQL (Structured Query Language)
- SQL is a language used to interact with the database. This helps you get data from the database, filter it and organize it.
- As a data analyst, most of your work will include working with large amounts of data stored in the database. SQL lets you easily go and analyze this data.
2. Excel
- Excel is a spreadsheet tool used for the organization and analysis of data. This is one of the most common data analysis devices.
- Many companies use Excel for fast data analysis, and it is great for basic functions such as filtration, sorting and calculation.
3. Python or R
- Pythan and R are programming languages used for more complex data analysis and automation.
- These devices are good for working with large data sets, automatic to repeat tasks and upgraded analysis.
- Python: Libraries such as Pandas (for data manipulation) and Matplotlib (for visualization).
- R: Popular for statistics and data visualization, with libraries such as ggplot2.
4. Data Visualization (Tableau, Power BI)
- These are devices that help you create interactive charts, graphs and dashboards to view visual data.
- Data showing people help understand it quickly and make better decisions. Companies use tools like Tableau or Power BI to create reports and dashboards.
- Data storytelling: Present your data in a way that tells a clear story.
5. Statistics and Probability
- Statistics are a study of data collection, analysis and interpretation. The opportunity helps you understand the possibility of events.
- A basic understanding of data helps you understand data, identify trends and provide predictions.
- Basic concepts such as mean, median, standard deviation, and correlation.
- Probability concepts such as normal distribution and hypothesis testing.
Step 3: Take Beginner-Friendly Courses
To start the journey as a data analyst, it is important to learn through structured courses. There are some initial friendly courses here, both free and paid, that will teach you the necessary skills such as SQL, Excel, Python, Data Islands and Statistics.
1. Entri
Entri offers a dedicated Data Analyst course that covers all the essential skills required to become a data analyst. With industry experts as mentors, along with quality materials, classes, and practical session, this course is one of the best out there. Additionally, the course can be availed in a vernacular language of your choice. Finally, a dedicated department for career placement provides an opportunity for being placed at a distinguished organisation.
Skills covered:
- Programming
- Data Visualisation
- Data Manipulation
- Data Cleaning
- Data Wrangling
Tools used:
- Python
- SQL
- Excel
- Power BI
- Power Query
2. Google
Google offers data analytics courses in various degrees: starting from beginner to advanced levels. Google provides these courses through their Grow with Google platform. Here is an overview of the course from Google:
- Google Data Analytics Certificate (Beginner Level)
-
This foundational program is ideal for those new to the field. It covers essential skills such as:
- Data types and structures
- Problem-solving with data
- Data analysis techniques
- Data storytelling through visualizations
- Utilizing tools like spreadsheets, SQL, Tableau, and R programming
-
Step 4: Work on Projects
Here are some initial friendly project ideas that help you practice data analysis skills:
1. Analyze a Dataset
- Choose a public dataset and analyze it. Look for patterns or trends.
- Analyze a global temperature or sales data set to find changes over time.
- Tools: Excel or Python.
2. Create a Sales Dashboard
- Use sales data for the construction of total sales, trends and dashboards showing top products.
- Tools: Tableau, Power BI, or Excel.
3. Customer Churn Analysis
- Customer data analysis to find out why customers stop using a service.
- Customers use data to find patterns that predict when they can leave.
- Tools: Excel, Python, or R.
4. Social Media Data Analysis
- Analyze data from social media (eg Twitter) to find trends, popular ishtags or user behavior.
- Tools: Python.
5. Employee Performance Analysis
- Employee data analyzes which departments have the best performance or highest satisfaction.
- Tools: Excel or Python.
“Ready to take your data science skills to the next level? Sign up for a free demo today!”
Step 5: Build a Portfolio
The construction of a portfolio is important to show its skills as a data analyst. This allows potential employers to look at your work and prove that you can use your knowledge on real projects. To effectively show your projects:
1. Showcase Projects on GitHub
Github is a platform where you can share your codes and projects with others. How to use it to display your data analysis assignment:
1. Create a GitHub Account: Sign up for an account in GitHub.
2. Upload Your Projects: Create a new depot (folder) for each project (folder) at Github. Upload all related files such as the code (Python, R, SQL), dataset and readme files.
3. Write a Clear README: The README file explains your project. Include:
- Project Title: What is the project about.
- Description: A small observation of what the project is doing.
- Steps Taken: Explain how to contact the problem (eg data cleaning, analysis, visualization).
- Tools Used: Mention tools or languages (eg: Python, Panda, Tableau).
- Screenshots: Bring screenshots of your visualization or dashboard.
4. Link Your GitHub: When your projects are on Github, you can restart or share the link with potential employers in your LinkedIn profile.
2. Build a Personal Website
Having an individual website is a great way to make your portfolio more professional and visually view your projects.
1. Choose a Platform: Use free site builders like Wix, WordPress or Github page to create your site.
2. Organize Your Projects: Create a dedicated “projects” part. For each project, include:
- Some sentences about the project.
- Show the tender, diagrams or screens.
- Give a link to the code at GitHub for those who want to find more.
3. Highlight Key Skills: On your website, list the equipment and skills you (eg Python, SQL, Tableau) and give links to your projects.
Step 6: Apply for Internships or Entry-Level Jobs
After the creation of your skills and portfolio, the time has come to start applying for internships or entry level posts. Here are some suggestions to start a strong resume and apply for jobs.
1. Resume Building Tips
Your CV is the first impression you give to potential employers, so make sure it effectively exposes your relevant skills and experience.
-
Contact Information: Create your name, phone number, e -post and LinkedIn/Github links to clearly visible visible at the top.
-
Professional Summary: Write a short sentence of 2-3 sentences, and highlight your skills, which you have learned, and what you are looking at (eg “Python, SQL and Tableau and Data Analyst with experience on hands in Tableau. Data analyzing. Dataisualization and strong skills in statistical analysis).
-
Skills Section: List of relevant technical skills (eg SQL, Excel, Python, Tableau, Data Vizulization). Mention soft skills, which means something like communication or problem solving.
-
Projects: Perform your best 2-3 projects from your portfolio (eg “Customer Driving Analysis using” Sales Dashboard “or” Python in Tableau “).
-
Education: Include educational background, certificate or relevant course (eg “Google Data Analytics Certificate” or “Include SQL for computer science).
-
Internships or Work Experience (if applicable): List of relevant internships or part -time roles. Even non-technical jobs can highlight skills such as teamwork, communication or problem solving.
2. Job Application Tips
Here are some suggestions to apply for practice and entry level jobs:
1. Use Job Search Platforms:
- Use platforms such as LinkedIn, actual glass door and angelist to search for internship analyst or junior roles.
2. Apply to Relevant Jobs:
- Be aware of posts or internships where they require 0-2 years of experience.
3. Write a Strong Cover Letter:
- Adapt the cover letter for each job application. Estate your enthusiasm for data analysis, what skills you provide, and why you are well suited for the role.
4. Network:
- Contact data analysts or recruit on LinkedIn. Party with their posts or send a personal message expressing their interest in their company.
5. Be Prepared for the Interview:
- Review the most important data analysis concepts (eg SQL questions, data visualization, basic statistics).
- Practice to explain your projects with simple words, focus on how to solve problems and equipment you use.
“Ready to take your data science skills to the next level? Sign up for a free demo today!”
Conclusion
Being a Data Analyst as a beginner is a rewarding journey that requires patience, practice and a strong learning mentality. By following this step-by-step road map, you can build a solid foundation in larger data analysis skills such as SQL, Excel, Python and Data visualization Tools. Working with projects, creating a portfolio and viewing your skills on platforms such as GITHUB or an individual website will give you confidence and reliability to stand out for potential employers.
The job application process can be competitive, but with a strong portion, a strong portfolio and an active approach to networking and learning, you will be on the right track to unload your first data analyst Practics or entry level job. Be engaged, keep learning, and you will be ready to start a successful career in data analysis.
| Related Links | |
| Data science career roadmap | Python Web Developer Roadmap |
| Full Stack Developer career path | Red Bull Marketing strategy |


