

Table of Contents
A few years back, no one would’ve imagined that a BCom degree in Finance would open up a career in Data Analytics. Fast forward a few years, and now anything is possible with finance graduates transitioning into the analytics field. If you are thinking of doing the same, this blog provides you with all the necessary details along with a detailed explanation on how to get started.
Check out this video by Entri in Malayalam!
Introduction: BCom Finance X Data Analytics
Data has transitioned into a substance with immense monetary value. It is an essential component that drives businesses to a great extent. Finance professionals play a vital role in handling data for businesses, as they are expected to report, analyse, interpret, and even throw in a few stories with it. For BCom graduates specialising in Finance, this opens up a great opportunity to transition into the high-demand world of data analytics.

Studying finance would’ve already exposed you to spreadsheets, financial ratios, and even likely forecasting models. These activities involve extracting insights from numbers, which is what data analytics is all about. Here are the reasons why transitioning to analytics makes sense for BCom graduates:
- Real-time decision-making: Businesses require quick decisions that are data-backed.
- Boom of analytics in finance: FP&A (Financial Planning & Analysis), risk analysis, and investment analysis are roles that are becoming data-centric, leading to a higher potential.
- Higher earnings: Skills in analytics can significantly boost your career growth and salary.
- Versatility: With mastery in analytics, you are not bound to finance alone; rather, you get to explore other roles in operations, marketing, supply chain, and more.
Also read: Roadmap: How To Become a Data Analyst & What Are The Skills Required?
Core Strengths That BCom Graduates Already Have
You might think that there are very few similarities between BCom Finance and Data Analytics that provide you with an opportunity. However, your degree provides you with a strong foundation that’s highly relevant in analytics. BCom Finance skills that make you relevant in analytics are as follows:
-
Quantitative and Analytical Thinking
Working with numbers, performing ratio analysis, and studying balance sheets sharpens your ability to spot trends and think critically.
-
Familiarity with Tools
Finance and Excel go hand-in-hand, similar to Excel being a necessary tool in analytics. Concepts such as pivot tables, lookups, and charts are directly applicable.
-
Business Context
With the acquired knowledge of accounting, financial management, and business operations, you would easily understand why the data matters and not just what it shows.
-
An Eye for Detail
Playing with finance demands accuracy and precision – traits that are invaluable in analytics, as a small error can lead to big misinterpretations.
Also read: How To Become A Data Analyst in Kerala
Data Analytics Roles for Finance Graduates
Being a finance graduate enables you to aim for roles that blend finance and data analysis. Such roles can be found in corporates, banks, fintech startups, consulting firms, and government bodies. Here are some of the roles that you can consider based on your degree.
-
Financial Analyst
Responsibilities include using historical data and market trends to forecast future financial outcomes, analyse performance, and prepare budgets.
-
Risk Analyst
Evaluate financial data to predict and assess potential risks in lending, business operations, or investments.
-
Investment Analyst
Analyse portfolio trends, stock performance, and market conditions by using quantitative data models.
-
Fraud Detection Analyst
Detect financial fraud and suspicious activity by identifying patterns while working with large datasets.
-
FP&A Analyst (Financial Planning & Analysis)
Support senior management by using data to create financial models, forecasts, and strategic plans.

Skills that BCom Finance Graduates Need to Learn to Bridge the Gap
Having a BCom degree in Finance already makes you familiar with numbers, business fundamentals, and financial decision-making. However, to transition into data analytics, some advanced technical and analytical skills are non-negotiable for you to acquire. These skills act as the bridge between your finance education and the world of data-driven decision-making. For better understanding, let us break them into two key categories.
-
Technical Tools and Platforms
Here are the tools that data analysts use to manipulate and visualise data. Find the easiest one for you to learn and slowly master the rest to make them relevant to your goal.
| Skill | Importance | Concepts to learn | Example |
| Microsoft Excel (Advanced) | Widely used in finance and analytics. | Pivot tables and charts, Lookup functions, Power Query, Data validation, Conditional formatting, Macros, VBA | Monthly financial dashboard showcasing department-wise vacancies and comparisons. |
| SQL (Structured Query Language) | Helps you pull, filter, sort, and join data from large datasets | SELECT, WHERE, ORDER BY, GROUP BY, HAVING, INNER, LEFT, RIGHT | Pull sales and cost data from a database and calculate profit margins by product or region. |
| Power BI | Visualisation helps turn raw data into interactive dashboards to communicate effectively, especially to non-tech stakeholders. |
|
Create a Power BI dashboard showing a company’s revenue trends, cost breakdowns, and profitability ratios over the last 12 months. |
| Tableau | |||
| Python (Optional) | Brings automation and scalability to your analysis |
|
Write a Python script that automatically downloads stock prices, calculates moving averages, and visualizes them. |
Also read: Data Analytics Case Studies: Real-World Success Stories and Lessons
-
Core Data and Analytical Concepts
Apart from the tools, you also need to understand the fundamentals of working with data and how data is cleaned, analysed, and insights are derived.
| Concept | Importance | Concepts to learn | Example |
| Data Cleaning and Preparation | Raw data is often messy, and cleaning it is the first and most important step in analysis. |
|
Clean a financial dataset where dates are inconsistently formatted, columns are mislabeled, and currency symbols are mixed. |
| Statistics for Data Analysis | Helps you to interpret data, identify trends, and avoid misleading confusion. |
|
Use correlation to examine the relationship between marketing spend and sales growth across regions. |
| Business and Financial KPIs | Understanding Key Performance Indicators (KPI) ensures that your insights are aligned with business needs. |
|
Use correlation to examine the relationship between marketing spend and sales growth across regions. |
| Storytelling with data | Create a story around the data you have analysed for better understanding and to make you stand out from others. |
|
Present a monthly finance review to leadership, highlighting key variances and actionable recommendations. |
How to Get Started with Data Analytics as a BCom Finance Graduate – A Step-by-Step Guide
With your BCom degree, you don’t need to start from scratch to break into data analytics. With the already acquired business knowledge, financial acumen, and analytical thinking, all you need to do now is build the right technical toolkit, get hands-on practice, and follow a clear path to secure your first analytics job. Here is a clear and detailed step-by-step guide for you to transition into data analytics with your degree.
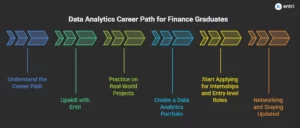
Step 1: Understand the Career Path
Before you start learning the tools and skills, you need to understand what data analytics in finance means and what your roles and responsibilities will be. It is equally important to decide on which role you want to be – financial analyst, FP&A analyst, BI analyst, or risk analyst – and dedicate your learning to that role as a goal. As a data analyst in a finance-focused role, you get to:
- Predict revenue and expenses
- Analyse performances and budgets
- Create dashboards for financial KPIs
- Identify trends in sales, costs, or investments
- Automate reports and insights for business leaders
Step 2: Upskill with Entri
Now that you’ve decided on a role and understood what to expect from your job, the next step would be to upskill yourself. Entri’s Data Analytics Course is a beginner-friendly and job-oriented program tailored for non-tech and BCom graduates. Here is a sneak peek of what you’ll be learning in this course:
-
Excel for data analysis – Advanced formulas, pivot tables, Power Query
-
SQL – Learn how to retrieve and manage structured data from databases
-
Power BI – Create interactive dashboards and reports
-
Python for data analysis – Basics of programming, automation, and visualization
-
Capstone Projects – Apply your learning to real-world financial scenarios
Step 3: Practice on Real-World Projects
“Practice makes theory perfect”. Develop a habit of seeking out and working on projects that have real-world applicability. This makes you approach the problem or the task from different perspectives and will develop better analysis and decision-making skills. Entri’s course provides projects with guidance from expert mentors to provide an opportunity where you can apply all the theory that you learned. You should also strive to work on other projects on your own to understand the mechanisms taking place. By the end of the course, aim to complete at least 3 – 4 projects.
Sample project ideas for you to consider:
-
Budget vs. Actual Analysis Dashboard (Power BI)
-
Stock Price Trends & Moving Averages using Python or Excel
-
Loan Default Risk Scorecard using SQL & visualization tools
-
Personal Finance Tracker with dynamic Excel dashboards
Step 4: Create a Data Analytics Portfolio
A strong portfolio is your key to landing your first data analytics job, since it is proof of your skills, and employers prefer candidates who have an impressive portfolio. Creating a strong, well-tailored portfolio is key in showing recruiters how you think, solve problems, and present data insights.
Remember to include these in your portfolio, as these points make you stand out among other candidates:
-
Project title + problem statement
-
Screenshots of dashboards or code
-
Business insights and outcomes
-
Tools used (Excel, SQL, Power BI, etc.)
-
GitHub or Google Drive links
You can use a variety of tools, such as GitHub, Tableau Public/Power BI Service, Notion, and Medium, for showcasing different aspects of your work.
Step 5: Start Applying for Internships and Entry-level Roles
Once you have mastered the tools for bridging the gap between your BCom Finance degree and Data Analytics career, it’s time to start looking for entry-level roles and internships that can propel you into the field of data analytics. With a strong portfolio containing details about your projects and works, you can look for or start applying for roles such as these:
-
Data Analyst Intern
-
Junior BI Analyst
-
Financial Analyst with Excel/SQL skills
-
FP&A Intern
-
MIS Executive / Reporting Analyst
Entri’s dedicated placement cell will help in securing your first role. They provide specialised guidance sessions with mentors on how to attend interviews, along with resume building. Entri’s Data Analytics Course ensures that you are job-ready to venture out and apply with confidence.

Step 6: Networking and Staying Updated
The perfect job for you might not necessarily come from job portals, but rather from connections that you make in various sectors, both online and offline. Leverage LinkedIn to connect with fellow Data Analysts as well as recruiters. Joining various finance and analytics communities on platforms such as Reddit is a good way to stay updated and gain insights on jobs, as well as various features. Make it a habit to attend webinars and virtual meetings conducted by platforms such as Entri.

Also read: Data Analyst Salary in Germany
Final Thoughts on BCom Finance + Data Analytics
Taking up data analytics doesn’t exactly mean that you are leaving your finance skills behind. Rather, you are elevating your skills to include more and tap into your potential. The finance world is not how it used to be. The finance world has evolved a lot, and employers want professionals who can go beyond spreadsheets or reports and bring data-driven insights to make decisions. With the right skills and a confident mindset, you can easily break into the world of data analytics with your finance background. With analytics taking the job market by storm, now is the time to enrol in Entri’s Data Analytics course and secure your future. Carve out your destiny with Entri!
|
Related Articles |
|
|
How Sales Professionals Can Explore a Career in Data Analytics |
Can Digital Marketing Professionals Switch Into A Data Analytics Career? |
Frequently Asked Questions
Can I get into data analytics with just a BCom in Finance?
Yes, absolutely. While technical degrees may offer some advantages, a BCom in Finance gives you strong business and numerical skills—both of which are critical in data analytics. By learning the right tools (like Excel, SQL, and Power BI), you can confidently transition into analytics roles.
Do I need to know programming to become a data analyst?
Not necessarily. You can start your data analytics journey with just Excel, SQL, and Power BI/Tableau. Python is useful but optional for many entry-level analyst roles. Entri’s course teaches Python in a beginner-friendly way if you decide to pick it up later.
How long does it take to become job-ready in data analytics?
It typically takes 3 to 6 months of consistent learning and project work to become job-ready—especially if you’re starting from a non-tech background. Entri’s structured course is designed to fit this timeline, helping you move from basics to projects efficiently.
What kind of roles can I apply for after completing a data analytics course?
As a BCom Finance graduate, you can apply for:
-
Data Analyst (Finance or Business domains)
-
Financial Analyst with Data Tools
-
FP&A Analyst
-
BI Analyst (Power BI/Tableau)
-
MIS/Reporting Analyst
-
Junior Data Analyst or Intern roles
These positions often value business understanding + analytical tools over coding expertise.
I’m from a non-technical background. Can I really get into data analytics?
Yes, absolutely. Data analytics does not require a computer science degree. As a BCom Finance graduate, you already have strong numerical, analytical, and business acumen. With the right tools and practical training (like Excel, SQL, Power BI, etc.), you can successfully shift into analytics roles, especially in finance-related domains.
Do I need to get certified to land a job?
While certifications are not mandatory, they can boost your profile and help you learn in a structured way. Completing Entri’s course and earning a certificate can make you stand out to employers, especially if paired with practical projects and a portfolio.
Can I switch to analytics while working a full-time job?
Yes. Many learners upskill while working full-time. With a flexible learning program like Entri’s, you can study in the evenings or weekends and gradually build your skills over a few months.
How can I showcase my skills to recruiters?
You can showcase your analytics skills by:
-
Building and sharing a portfolio (via GitHub, Tableau Public, or Notion)
-
Posting your projects or learning journey on LinkedIn
-
Customizing your resume to include tools, projects, and KPIs
-
Applying to jobs with titles like “Data Analyst Intern”, “Financial Analyst with BI”, or “FP&A Trainee”


