

Table of Contents
In trading, chart patterns refer to recognizable formations that emerge on a price chart of a financial instrument, such as a stock, currency, or commodity. Chart patterns are created by the movement of prices over time. They provide traders with valuable insights into market trends and price movements. By recognizing these patterns, traders can make informed decisions about buying, selling, or holding a particular security. Here we shall discuss Top 15 Chart Patterns Every Trader Need to Know.
Chart patterns can be divided into two main categories: reversal patterns and continuation patterns. Reversal patterns indicate a potential change in the direction of a trend. Continuation patterns suggest that the current trend will continue.
Examples of common chart patterns include head and shoulders, flag and pennant, trend lines, triangles, cup and handle etc.
Learn Stock Marketing with Share Trading Expert! Explore Here!
Types of Chart Patterns Trading
There are several types of chart patterns that traders use in technical analysis. Here are some of the most common chart patterns:
Reversal Patterns: These patterns indicate a potential change in the direction of a trend. Examples include:
- Head and Shoulders
- Reverse Head and Shoulders
- Double Tops and Bottoms
- Triple Tops and Bottoms
Continuation Patterns: These patterns indicate that the current trend will continue after a temporary pause in price action. Examples include:
- Flag and Pennant
- Wedges (Rising and Falling)
- Rectangle
Consolidation Patterns: These patterns indicate a period of indecision in the market. Here the price of an asset is moving within a range. Examples include:
- Triangles (Ascending, Descending, Symmetrical)
- Diamond
Momentum Patterns: These patterns are used to identify potential changes in momentum and indicate potential trend reversals. Examples include:
- Bullish and Bearish Divergence
- Gap
- Island Reversal
- Hikkake Pattern
Trend-Following Patterns: These patterns are used to identify current trends and make trading decisions accordingly.Examples include:
- Trend Line
- Trend Channel
- Moving Averages
Start investing like a pro. Enroll in our Stock Market course!
Top 15 Stock Chart Patterns
1: What is a stock?
Here are the 15 most common chart patterns that every trader should be aware of:
Chart patterns are graphical representations of market trends and price movements that traders can use to identify potential trading opportunities. Here is a brief introduction to some common chart patterns:
- Head and Shoulders
- Reverse Head and Shoulders
- Flag and Pennant
- Trend Line
- Trend Channel
- Triangles (ascending, descending, symmetrical)
- Double and Triple Tops and Bottoms
- Rectangle
- Wedge (rising and falling)
- Cup and Handle
- Diamond
- Bullish and Bearish Divergence
- Gap
- Island Reversal
- Hikkake Pattern
All the Top 15 chart patterns every trader need to know are discussed below:
Head and Shoulders Chart Pattern
The “head and shoulders” chart pattern is a pessimistic reversal pattern. It is used to identify potential changes in the trend of a financial security’s price.
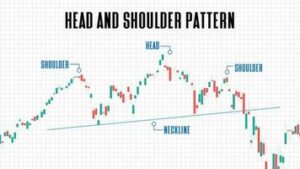
It is characterized by three peaks. The middle peak (the “head”) being the highest. The two surrounding peaks (the “shoulders”) being lower and roughly equal in height.
A downward trend line drawn along the lows of the shoulders and head represents the “neckline”. A break below the neckline is considered a confirmation of the reversal. This indicates that the prices are likely to continue falling. The height of the head and shoulders formation is used to estimate the potential size of the downward price move that could follow the break of the neckline.
Reverse Head and Shoulders Chart Pattern
The reverse head and shoulders pattern is a bullish reversal chart pattern that is seen in stock charts. It is a technical analysis tool that signals a potential trend reversal from a downward trend to an upward trend.
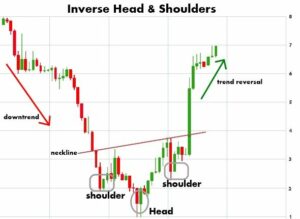
The pattern consists of two troughs that are roughly equal, followed by a deeper low, then another peak that is higher than the previous peaks, creating the “shoulders”, followed by a final low, which creates the “head” of the pattern. A reversal of the trend is signaled when the price breaks above the “neckline” connecting the two peaks. This pattern is used by traders to identify potential buying opportunities.
Master stock trading with us. Enroll now for a free demo!
Flag and Pennant Chart Pattern
The flag and pennant chart patterns are technical analysis tools used in stock trading to identify potential trend continuations.
A flag pattern is a consolidation period within an uptrend or downtrend. It is characterized by a narrowing price range and lower volatility. The flag pattern usually preceded by a sharp price movement in one direction (the “flagpole”). It is considered a bullish or bearish continuation pattern depending on the direction of the preceding trend. A bullish flag pattern is confirmed when the price breaks above the upper trendline of the flag. A bearish flag pattern is confirmed when the price breaks below the lower trendline of the flag.
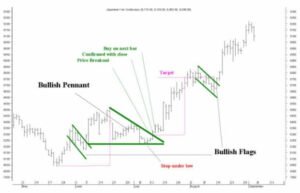
A pennant pattern is similar to a flag pattern but is triangular in shape instead of rectangular. It is considered a continuation pattern and signals a potential continuation of the preceding trend, just like the flag pattern. A bullish pennant pattern is confirmed when the price breaks above the upper trendline of the pennant and a bearish pennant pattern is confirmed when the price breaks below the lower trendline of the pennant.
Traders use these patterns as potential trading opportunities, buying when the price breaks out of a bullish pattern or shorting when the price breaks out of a bearish pattern.
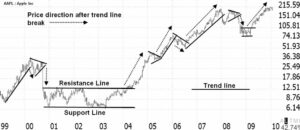
Trend Line Chart Pattern
A trend line is a straight line that is drawn on a chart to connect two or more price points and is used to identify a current trend in the market. In technical analysis, trend lines are used to identify support and resistance levels, which are key areas where the price may potentially change direction.
A trend line can be used to identify an uptrend, when the line is drawn along the lows and connects a series of increasing lows, or a downtrend, when the line is drawn along the highs and connects a series of decreasing highs. When the price approaches a trend line, traders will watch for signs of a potential trend reversal or a break through the line, which could signal a continuation of the trend.
Traders often use trend lines in combination with other technical indicators, such as moving averages and oscillators, to confirm the strength of the trend and make informed trading decisions.
Trend Channel Chart Pattern
A trend channel is a chart pattern that is used in technical analysis to identify a trend and its potential future price movements. It is formed by drawing two parallel trend lines, one above and one below the price action, creating a channel within which the price is expected to move.
The upper trend line acts as a resistance level, while the lower trend line acts as a support level. As long as the price remains within the channel, the trend is considered to be intact and traders may look for buying opportunities near the lower trend line and selling opportunities near the upper trend line.
A break outside of the trend channel could signal a change in the trend direction, and traders may adjust their positions accordingly. The slope of the trend channel can also be used to determine the strength of the trend and to identify potential turning points.
It is important to note that trend channels are not exact and the slope and angle of the trend lines may change as new price data becomes available. Trend channels are often used in conjunction with other technical indicators to confirm the strength of the trend and to make informed trading decisions.
Start investing like a pro. Enroll in our Stock Market course!
Triangles (ascending, descending, symmetrical) Chart Pattern
Triangles are chart patterns that are used in technical analysis to identify potential trend reversals or continuations. There are three types of triangles: ascending, descending, and symmetrical.
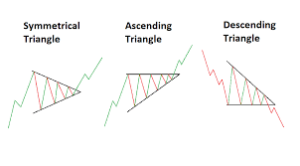
An ascending triangle is a bullish pattern that is formed when the price is making higher lows and is being met with resistance at a horizontal level. This pattern signals that the bulls are taking control and the price is expected to break through the resistance and continue to move higher.
A descending triangle is a bearish pattern that is formed when the price is making lower highs and is being met with support at a horizontal level. This pattern signals that the bears are in control and the price is expected to break through the support and continue to move lower.
A symmetrical triangle is a pattern that occurs when the price is making lower highs and higher lows, creating two converging trendlines that form a triangle shape. This pattern signals a period of consolidation and a potential trend reversal, but it does not indicate the direction of the future price movement.
Traders use these patterns to identify potential trading opportunities, such as entering a position in the direction of the expected breakout or closing a position if the pattern signals a trend reversal. It’s important to note that triangles are not exact and the pattern may not always develop as expected, so traders use other technical indicators to confirm the pattern and make informed trading decisions.
Double and Triple Tops and Bottoms Chart Pattern
These chart patterns that occur in technical analysis are used by traders to predict potential price reversal points in a security.
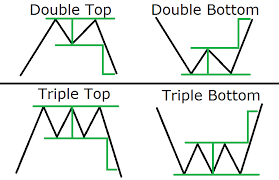
Double Top: A double top is formed when the price of a security reaches a high point, pulls back, then reaches the same high point again, but fails to break through and starts to decline. This pattern signals a potential trend reversal from bullish to bearish.
Double Bottom: A double bottom is the opposite of a double top and signals a potential trend reversal from bearish to bullish. It is formed when the price of a security reaches a low point, pulls back, then reaches the same low point again, but fails to fall further and starts to rise.
Triple Tops and Bottoms are similar to Double Tops and Bottoms, but instead of the price reaching the same high or low point twice, it reaches the same high or low point three times.
Triple Top: A triple top is formed when the price of a security reaches a high point, pulls back, then reaches the same high point two more times, but fails to break through and starts to decline. This pattern signals a stronger potential trend reversal from bullish to bearish.
Triple Bottom: A triple bottom is the opposite of a triple top and signals a stronger potential trend reversal from bearish to bullish. It is formed when the price of a security reaches a low point, pulls back, then reaches the same low point two more times, but fails to fall further and starts to rise.
Start investing like a pro. Enroll in our Stock Market course!
Rectangle Chart Pattern
A Rectangle is a chart pattern that occurs in technical analysis and is used by traders to predict potential price breakouts in a security. It is formed when the price of a security moves between two parallel horizontal lines, creating a “rectangle” shape on the price chart.
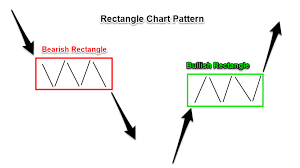
The top line acts as resistance and the bottom line acts as support. If the price breaks out of the rectangle pattern to the upside, it is a bullish signal, indicating that the security is likely to rise. If the price breaks out to the downside, it is a bearish signal, indicating that the security is likely to fall.
Rectangles often occur during periods of consolidation, where the security’s price is moving sideways and traders are unsure about its future direction. The length of the rectangle can vary, but typically lasts several weeks to several months.
Traders will often wait for a clear breakout from the rectangle before entering a trade in the direction of the breakout. The height of the rectangle can also provide an estimate for the potential price target in the direction of the breakout.
Wedge (rising and falling) Chart Pattern
A Wedge is a chart pattern that occurs in technical analysis is used by traders to predict potential price breakouts in a security. There are two types of wedge patterns: rising wedges and falling wedges.
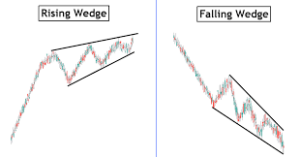
Rising Wedge: A rising wedge is a bearish pattern that forms when the price of a security is making higher lows and higher highs, but the highs are occurring at a slower rate than the lows. This pattern is formed by two upward-slanting trendlines that are converging, creating a “wedge” shape on the price chart. If the price breaks down from the rising wedge, it is a bearish signal, indicating that the security is likely to fall.
Falling Wedge: A falling wedge is a bullish pattern that forms when the price of a security is making lower lows and lower highs, but the lows are occurring at a slower rate than the highs. This pattern is formed by two downward-slanting trendlines that are converging, creating a “wedge” shape on the price chart. If the price breaks up from the falling wedge, it is a bullish signal, indicating that the security is likely to rise.
Wedge patterns often occur during periods of consolidation, where the security’s price is moving sideways and traders are unsure about its future direction. The length of the wedge can vary, but typically lasts several weeks to several months.
Traders will often wait for a clear breakout from the wedge before entering a trade in the direction of the breakout. The height of the wedge can also provide an estimate for the potential price target in the direction of the breakout.

Cup and Handle Chart Pattern
The Cup and Handle is a chart pattern is used by traders to predict potential price breakouts in a security. It is formed when the price of a security creates a rounded “cup” shape on the price chart, followed by a small downward correction in the form of a “handle.”
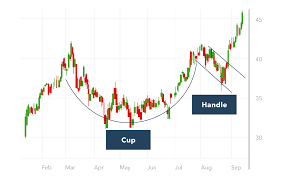
The “cup” shape is created as the price of the security rises, reaches a peak, and then pulls back to form the bottom of the cup. The “handle” is created as the price makes a small downward correction before breaking out of the pattern to the upside. This pattern is considered to be a bullish signal, indicating that the security is likely to rise.
The height of the cup and handle can provide an estimate for the potential price target in the direction of the breakout. Traders will often wait for a clear breakout from the pattern before entering a trade in the direction of the breakout.
Diamond Chart Pattern
The Diamond Chart pattern is a rare reversal pattern that occurs in technical analysis and is used by traders to predict potential price reversals in a security. It is formed when the price of a security creates a diamond shape on the price chart, characterized by two downward sloping trendlines and two upward sloping trendlines that converge to form the diamond shape.
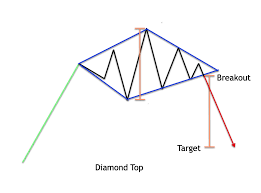
The Diamond Chart pattern is a reversal pattern. It typically occurs after a strong bullish trend, with the price moving higher and then starting to reverse and move lower. If the price breaks down from the this pattern, it is a bearish signal. This indicates that the security is likely to fall. If the price breaks out to the upside, it is a bullish signal. This indicates that the security is likely to rise.
Traders will often wait for a clear breakout from the Diamond Chart pattern before entering a trade in the direction of the breakout. The height of the pattern can also provide an estimate for the potential price target in the direction of the breakout.
Start learning share trading today!
Bullish and Bearish Divergence Chart Pattern
Bullish and Bearish Divergences are chart patterns are used by traders to predict potential price reversals in a security.
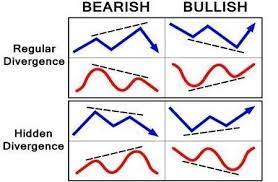
Bullish Divergence: A Bullish Divergence is a pattern that forms when the price of a security is making lower lows, but a technical indicator, such as the Relative Strength Index (RSI) or the Moving Average Convergence Divergence (MACD), is making higher lows. This is a bullish signal which indicates that the security is likely to rise.
Bearish Divergence: A Bearish Divergence is a pattern that forms when the price of a security is making higher highs, but a technical indicator, such as the Relative Strength Index (RSI) or the Moving Average Convergence Divergence (MACD), is making lower highs. This is a bearish signal which indicates that the security is likely to fall.
Divergences are the early warning signals of potential trend reversals. The traders will often wait for confirmation of the reversal. Which include break of a support or resistance level, before entering a trade in the direction of the reversal.
Gap Chart Pattern
A Gap is a chart pattern that occurs when there is a noticeable jump or “gap” in the price of a security on a price chart, with no trading taking place within the gap. Gaps can occur in both bullish and bearish trends. It provides valuable information to traders about the future price direction of a security.
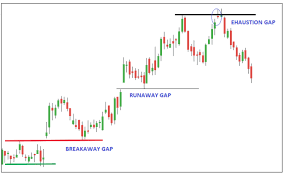
There are several types of gaps in trading:
Breakaway Gap: A Breakaway Gap occurs at the beginning of a trend. This signals a potential price break out in the direction of the gap. This type of gap is typically bullish in a bullish trend and bearish in a bearish trend.
Continuation Gap: A Continuation Gap occurs within a trend. This signals that the trend is likely to continue in the direction of the gap.
Exhaustion Gap: An Exhaustion Gap occurs at the end of a trend. This signals that the trend may be losing momentum and that a price reversal may be imminent.
Island Reversal Chart Pattern
An Island Reversal is a chart pattern in technical analysis of stocks, forex, or other financial instruments. It is a bullish reversal pattern that is formed when the price of an asset gaps highers and then gaps lower, creating an “island” of trading activity that is separated from the preceding and following price activity.
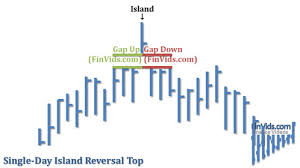
This pattern indicates a potential change in trend, with the gap lower signaling that bears have taken control and that the price may continue to decline. This pattern is rare and traders use other technical indicators or analysis to confirm the reversal before making a trade.
Hikkake Pattern Chart Pattern
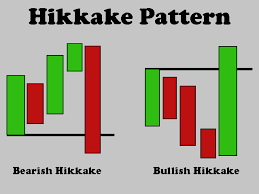
The Hikkake pattern is used in technical analysis to identify potential reversals or continuation of a trend. It is a variation of the inside bar pattern which is named after the Japanese word “hikkake” meaning “trick”. The pattern is formed when the price action of an asset creates a false breakout of a price range, followed by a rapid move in the opposite direction. The false breakout signals a possible trap for traders who were betting on the direction of the initial move. The Hikkake pattern is a short-term reversal pattern. The traders often use other technical indicators or analysis to confirm the reversal before making a trade.
Learn Stock Marketing with Share Trading Expert! Explore Here!
Conclusion
In conclusion, Top 15 Chart Patterns Every Trader Need to Know was discussed. Chart patterns play an important role in technical analysis. It can help traders identify potential trends and reversals in the market. However, it’s important to keep in mind that chart patterns are just one tool in a trader’s arsenal. One should not rely upon them while making trading decisions. You can use chart patterns along with other technical indicators and analysis, like moving averages, volume analysis etc. Additionally, traders should also consider fundamental factors like economic data, company-specific news, to get a better view of the market.
Stock Market Training Reviewed & Monitored by SEBI Registered Investment Advisor
Trusted, concepts to help you grow with confidence. Enroll now and learn to start investing the right way.
Know moreFrequently Asked Questions
What is a chart pattern in trading?
A chart pattern is a recognizable formation of price and/or volume data that appears on a stock chart. They are used to predict future price movements.
What are the most common chart patterns?
The most common chart patterns are:
- Head and Shoulders
- Triangle
- Flag and Pennant
- Double/Triple Top and Bottom
- Cup and Handle
How are chart patterns used in trading?
Chart patterns are used to identify potential buy or sell opportunities. When the pattern is confirmed, traders take positions in anticipation of a price move in the predicted direction.
How reliable are chart patterns?
Chart patterns are not foolproof and past performance is not indicative of future results. Traders should consider other technical and fundamental factors before making a trade.


